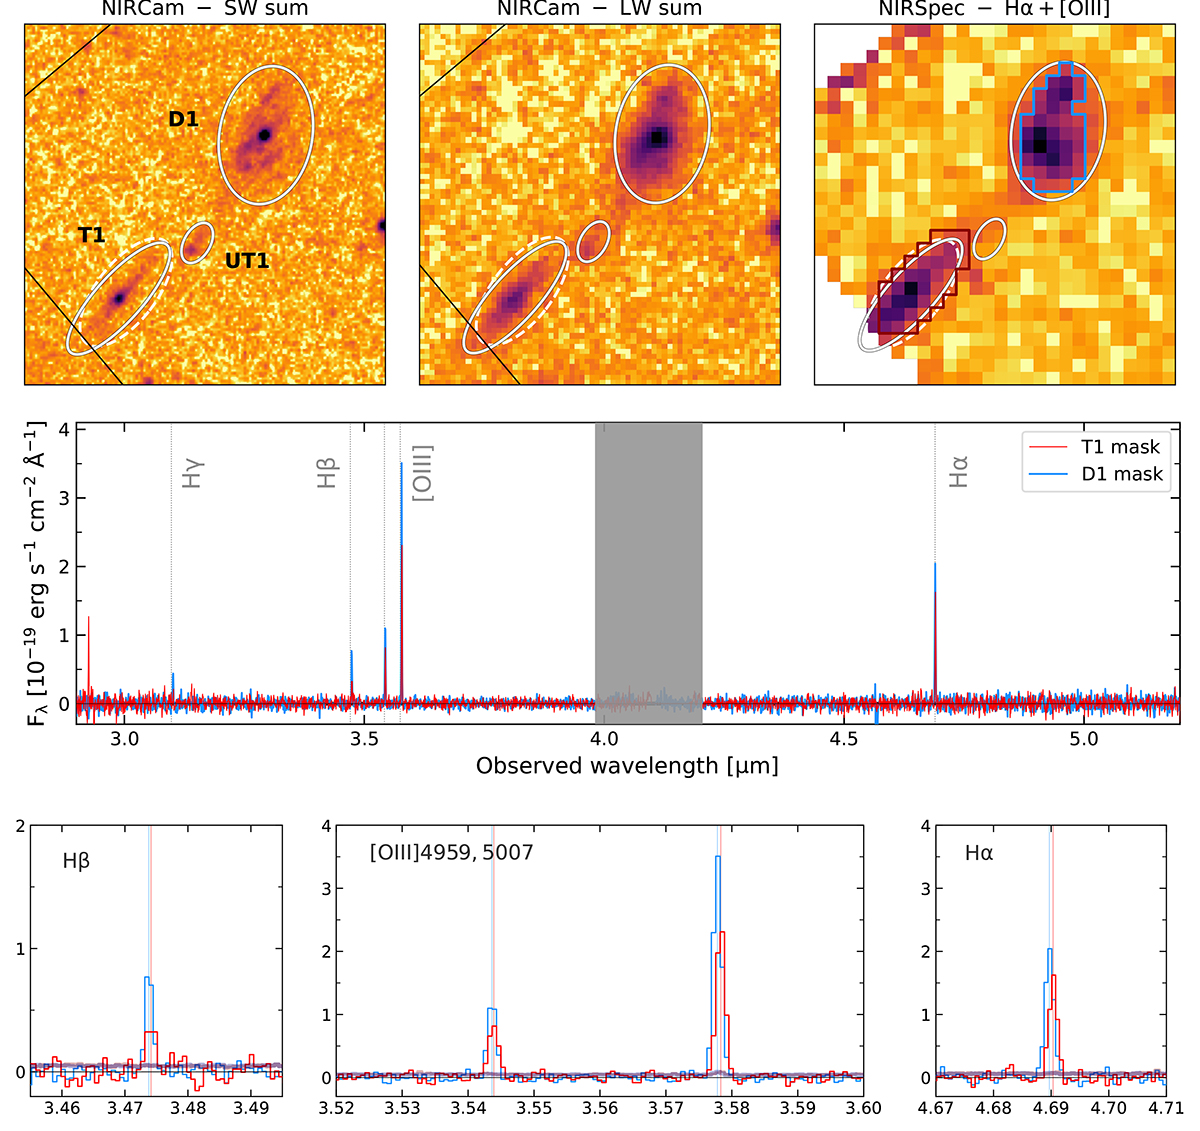
Fig. 2.
Download original image
Imaging and spectroscopy of the D1T1 system. Top panels: Cutouts showing the observed systems in the sum of NIRCam SW (F115W, F150W, F200W, left) and LW (F277W, F356W, F410M, F444W, center) filters and a NIRSpec-IFU map with the sum from Hα, Hβ, and [OIII] line emission (right). White ellipses mark the apertures used to extract photometry of the three main regions (labeled in the left panel). The white dashed aperture is used only to compare NIRCam to NIRSpec-derived quantities for the T1 region (see Sect. 3.4). The right panel also contains the pixel masks (blue and red contours) used to extract the spectra shown in the bottom panels. Middle panel: Spectra for D1 and T1 regions (in blue and red, respectively). No stellar or nebular continuum is detected in the spectra. The gray shaded area marks the wavelength range falling in the NIRSpec detectors’ gap. The insets in the bottom panels are zoom-ins around the detected lines and display also the uncertainty of the spectra (as wide shaded lines). The best-fit center of the lines is displayed as vertical lines and reveals a small shift in redshift between the two regions (corresponding to a velocity shift of ∼42 km/s; see also Fig. 5, Sect. 3.4 and Appendix D).
Current usage metrics show cumulative count of Article Views (full-text article views including HTML views, PDF and ePub downloads, according to the available data) and Abstracts Views on Vision4Press platform.
Data correspond to usage on the plateform after 2015. The current usage metrics is available 48-96 hours after online publication and is updated daily on week days.
Initial download of the metrics may take a while.