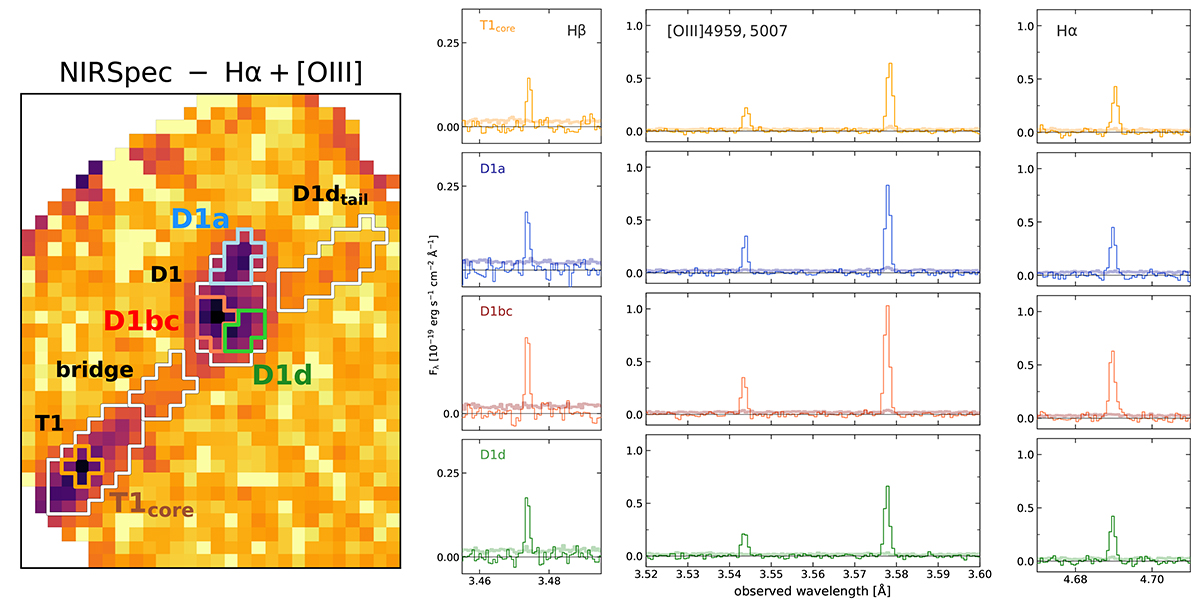
Fig. G.1.
Download original image
Left panel: map of the Hα+[OIII] emission from NIRSpec-IFU; the masks used to extract the spectra of the subregions discussed in Sect. 4.1 and Sect. 4.2 are over-imposed. The relative spectra (covering the wavelengths around Hβ, [[O III]λλ4959, 5007] and Hα) are shown in the right panels. All the other IFU masks used in this work (and shown in Fig. 2 and 6) are included for comparison as white contours (with black labels).
Current usage metrics show cumulative count of Article Views (full-text article views including HTML views, PDF and ePub downloads, according to the available data) and Abstracts Views on Vision4Press platform.
Data correspond to usage on the plateform after 2015. The current usage metrics is available 48-96 hours after online publication and is updated daily on week days.
Initial download of the metrics may take a while.