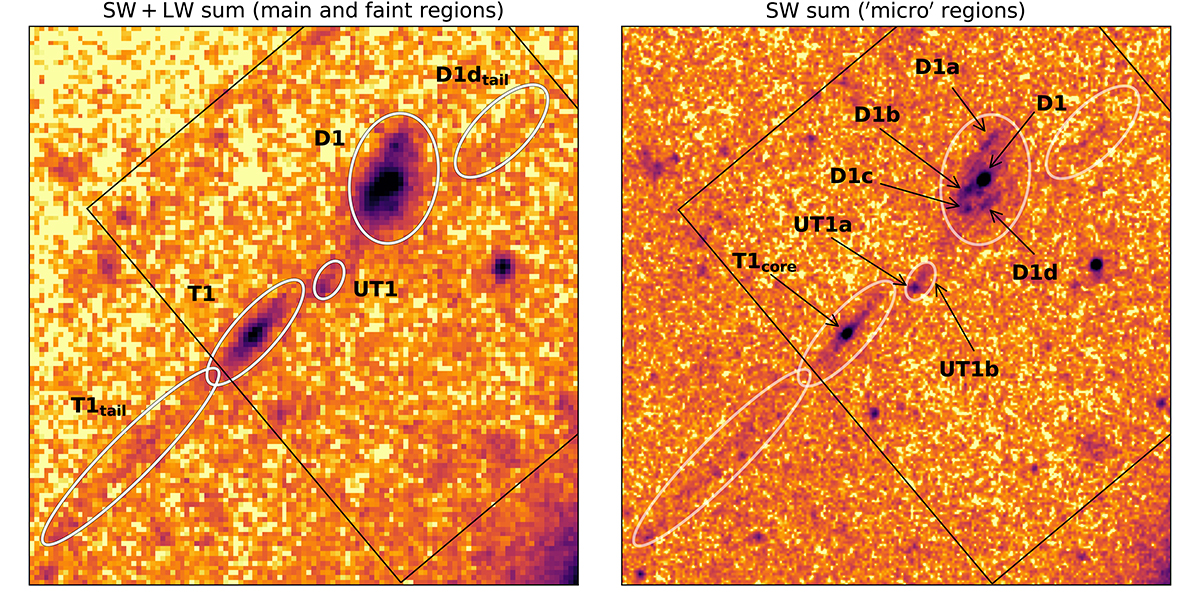
Fig. B.1.
Download original image
Left panel: the three main regions (D1, T1, and UT1; Sect. 3), along with the two “faint” regions discussed in Sect. 3.5, on top of the sum of all SW and LW filters’ observations. Right panel: All the micro regions discussed in Sect. 4, on top of the sum of the SW filters’ observations. The ellipses marking the extent of the main regions are kept, in transparency. In both panels the FoV of the IFU is shown as a black contour. All the IFU masks used in this work are shown in Appendix G.
Current usage metrics show cumulative count of Article Views (full-text article views including HTML views, PDF and ePub downloads, according to the available data) and Abstracts Views on Vision4Press platform.
Data correspond to usage on the plateform after 2015. The current usage metrics is available 48-96 hours after online publication and is updated daily on week days.
Initial download of the metrics may take a while.