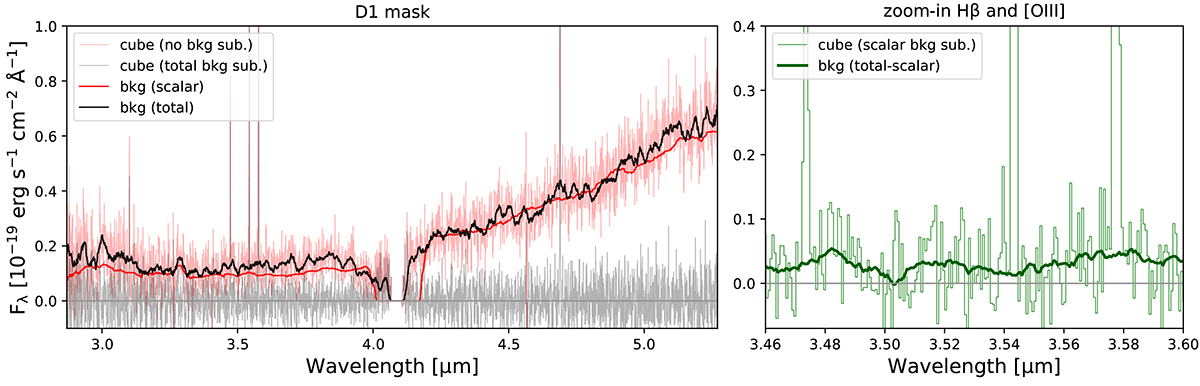
Fig. A.2.
Download original image
Left panel: Spectra extracted in the D1 mask (see Fig. 2) for the cube without background subtraction (light red line) and after the background subtraction (gray line), where the solid black line is the total measured background (based on a moving median across 30 slices) within the mask. The solid red line is the background obtained using one scalar value per slice. Right panel: the difference between the total background and the scalar one is shown as a dark green thick line, in a zoom-in at the wavelengths of Hβ, [O III]λ4959 and [O III]λ5007 emission lines. The residual signal produced using only the scalar background is also shown as a thin green histogram, for reference.
Current usage metrics show cumulative count of Article Views (full-text article views including HTML views, PDF and ePub downloads, according to the available data) and Abstracts Views on Vision4Press platform.
Data correspond to usage on the plateform after 2015. The current usage metrics is available 48-96 hours after online publication and is updated daily on week days.
Initial download of the metrics may take a while.