Fig. A.1.
Download original image
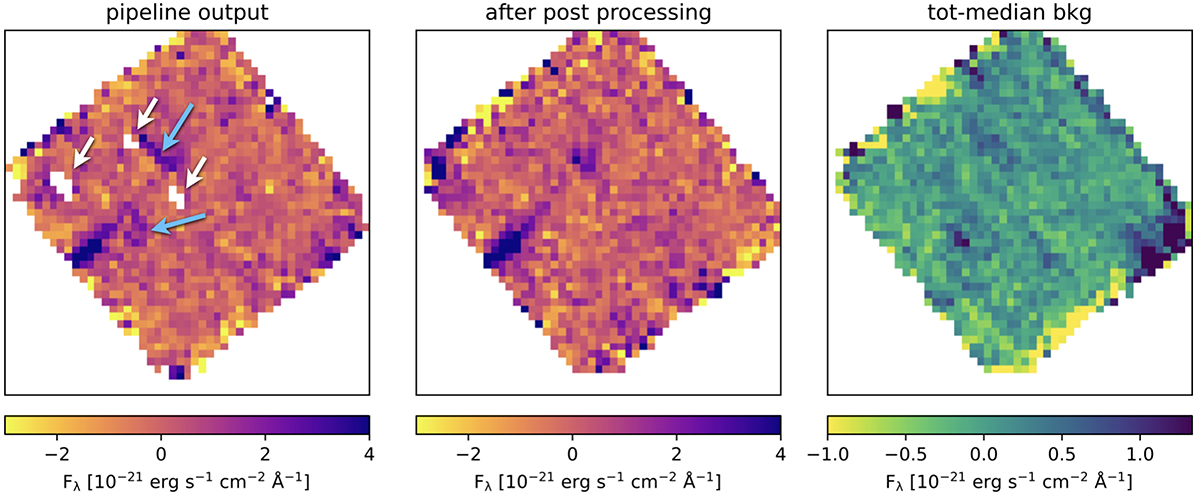
Left panel: A slice (corresponding to λ = 4.69 μm) of the final cube produced via the standard JWST-NIRSpec pipeline, showing Hα emission from the T1 region (see also Fig. 2) but also spurious signal blending with the real one (indicated by the blue arrows) and nan pixels (indicated by the white arrows). The same slice, for the cube post-processed by our custom pipeline, is shown in the central panel. Right panel: the residual background, after subtracting a scalar median one (i.e., the dark green background in Fig. A.2), is shown for the same slice; background spatial variations on the order of ∼10−21 erg s−1 cm−2 Å−1 are observed.
Current usage metrics show cumulative count of Article Views (full-text article views including HTML views, PDF and ePub downloads, according to the available data) and Abstracts Views on Vision4Press platform.
Data correspond to usage on the plateform after 2015. The current usage metrics is available 48-96 hours after online publication and is updated daily on week days.
Initial download of the metrics may take a while.