Fig. 11.
Download original image
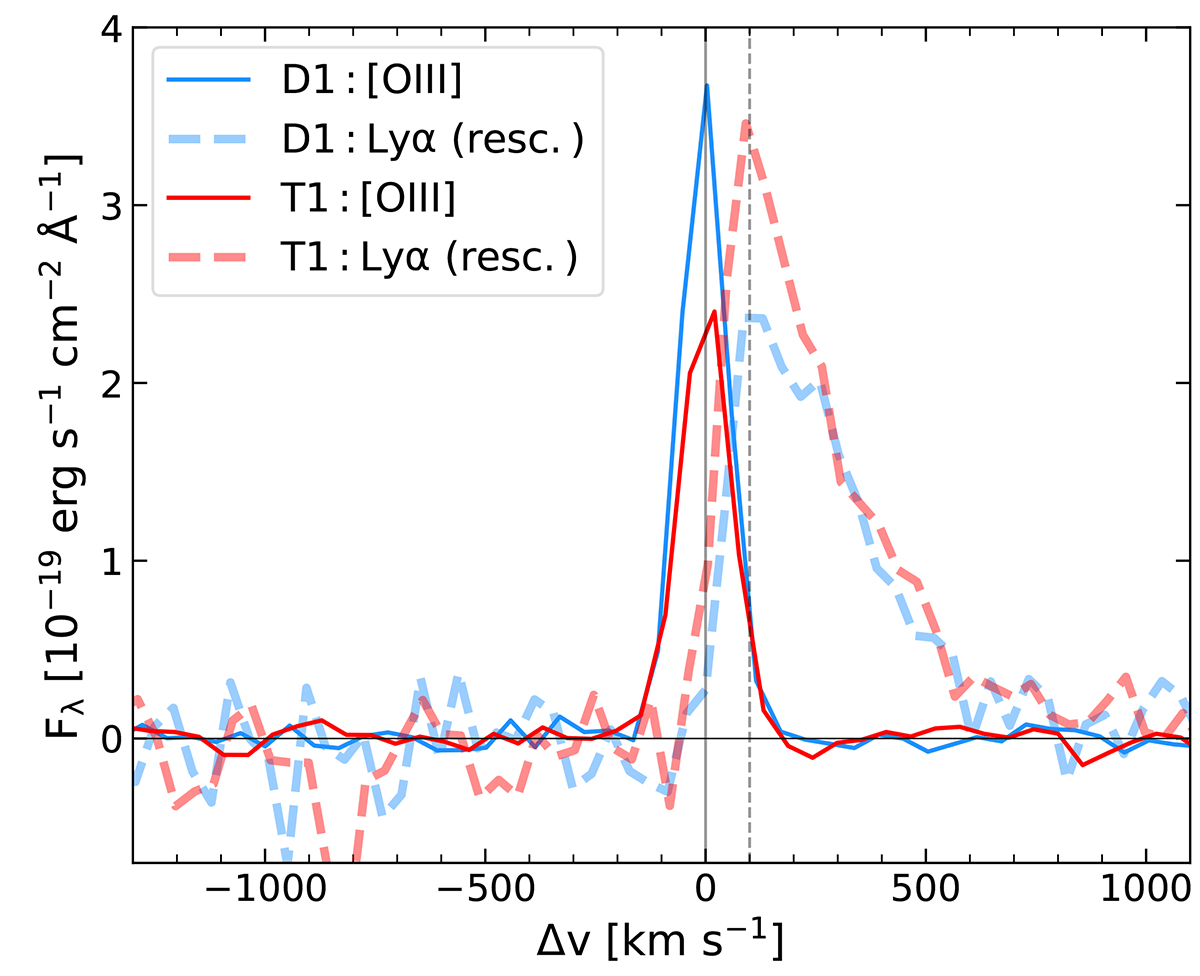
Comparison between the [[O III]λ5007] line emission of the D1 (solid blue) and T1 (solid red) regions (extracted from the spectra presented in Fig. 2) and the Lyα flux observed at the same position (from VLT/MUSE; see Vanzella et al. 2019, 2021), rescaled by a factor 0.5 in order to ease the comparison of the peak relative velocities. For both regions, the center of the [O III]λ5007 line has been used as the systemic redshift and therefore as reference for the x-axis. The Lyα line peaks at Δv ∼ +100 km s−1 in both regions.
Current usage metrics show cumulative count of Article Views (full-text article views including HTML views, PDF and ePub downloads, according to the available data) and Abstracts Views on Vision4Press platform.
Data correspond to usage on the plateform after 2015. The current usage metrics is available 48-96 hours after online publication and is updated daily on week days.
Initial download of the metrics may take a while.