Fig. 6
Download original image
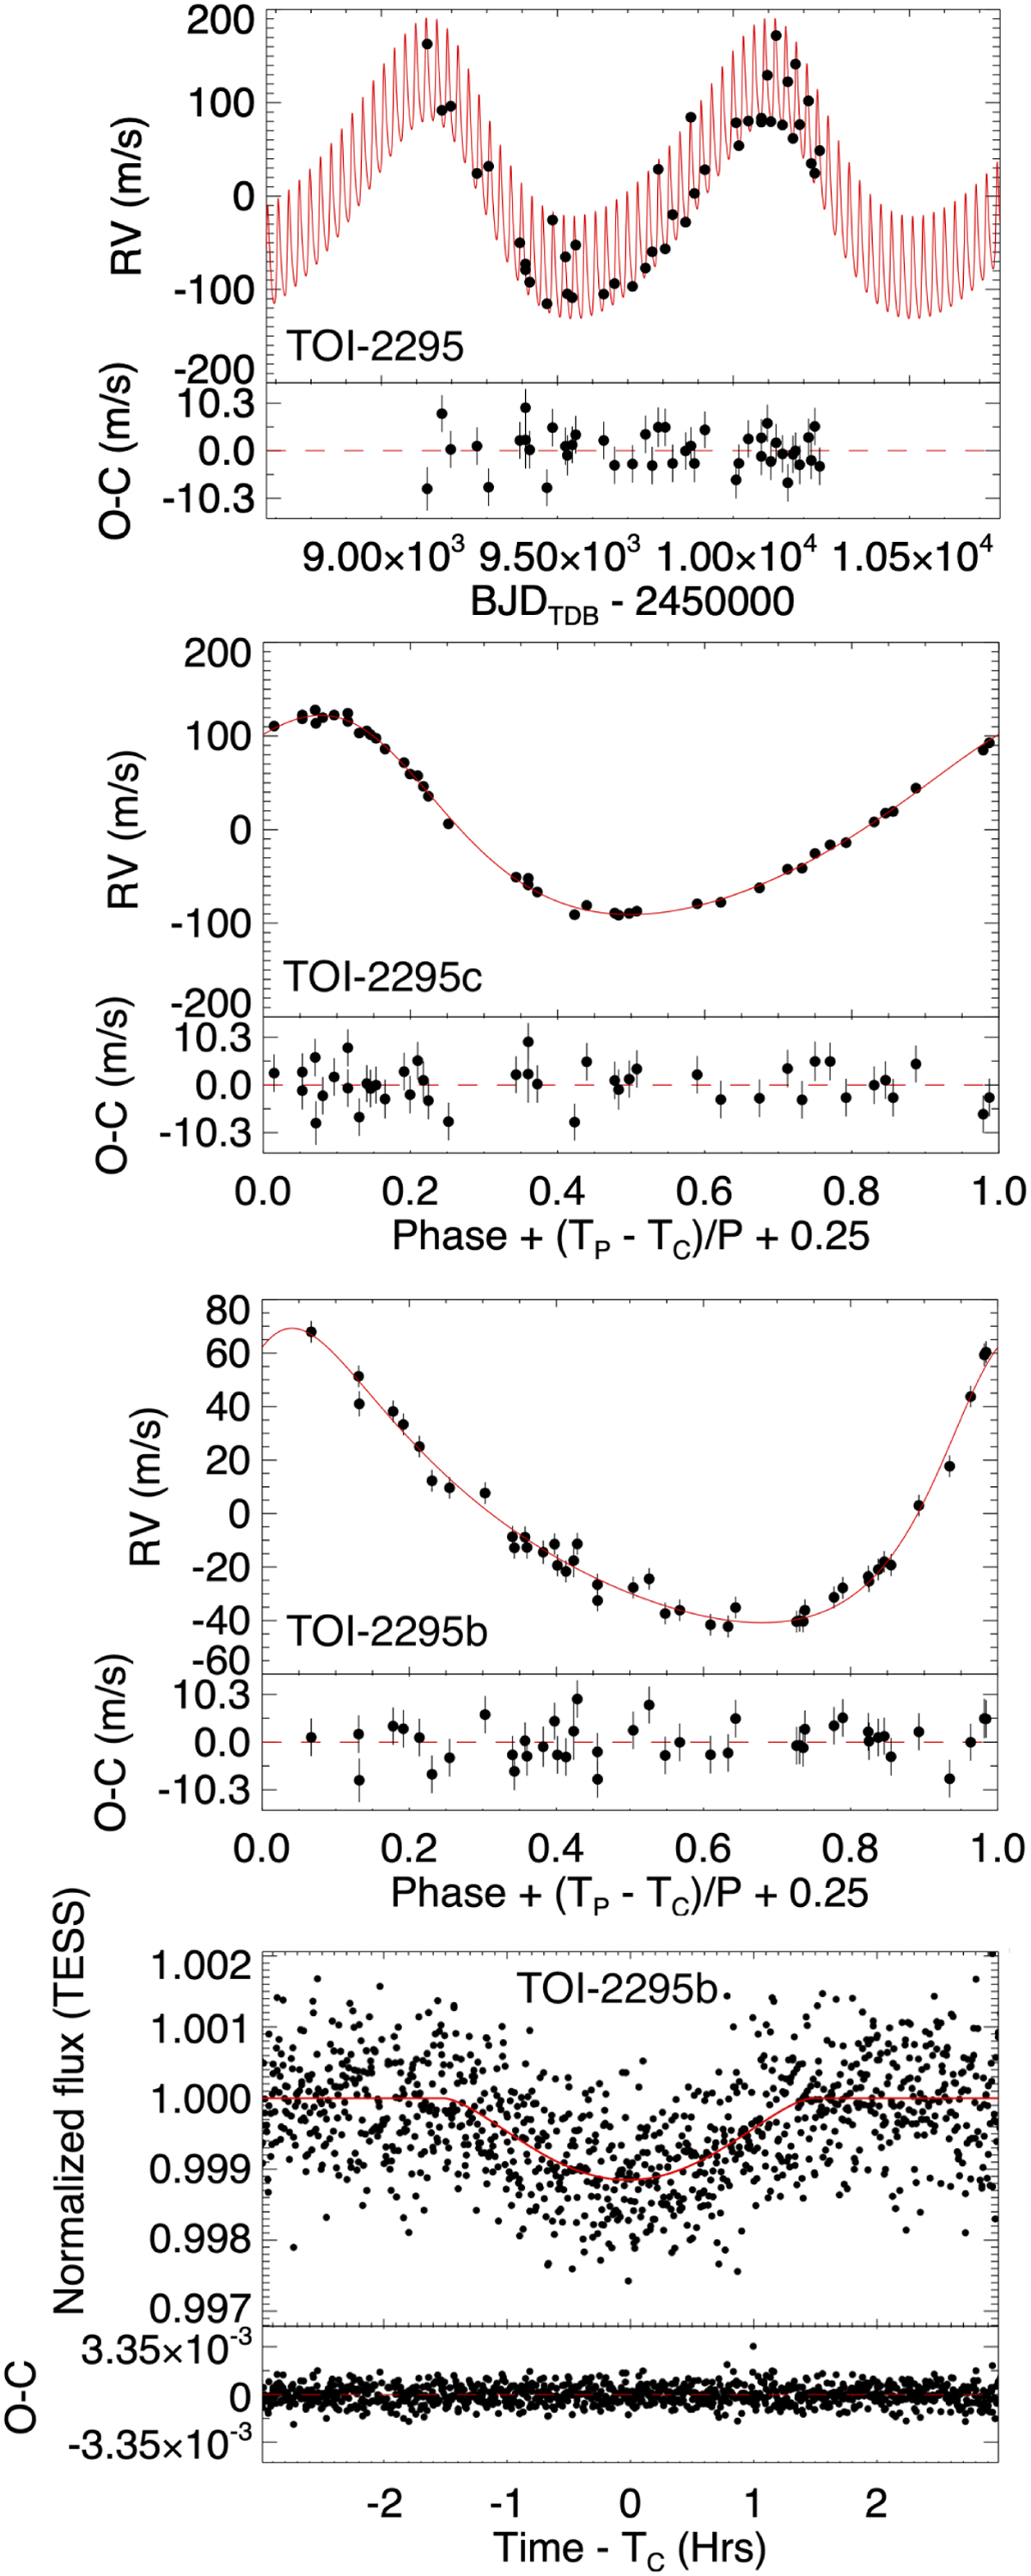
SOPHIE RV measurements of TOI-2295 (top panel), phasefolded RV measurements for TOI-2295c (second panel) and TOI-2295b (third panel), along with the phase-folded TESS light curve for TOI-2295b (bottom panel). The red lines represent the median of median models using EXOFASTv2. Residuals of the data are plotted at the bottom of each panel.
Current usage metrics show cumulative count of Article Views (full-text article views including HTML views, PDF and ePub downloads, according to the available data) and Abstracts Views on Vision4Press platform.
Data correspond to usage on the plateform after 2015. The current usage metrics is available 48-96 hours after online publication and is updated daily on week days.
Initial download of the metrics may take a while.