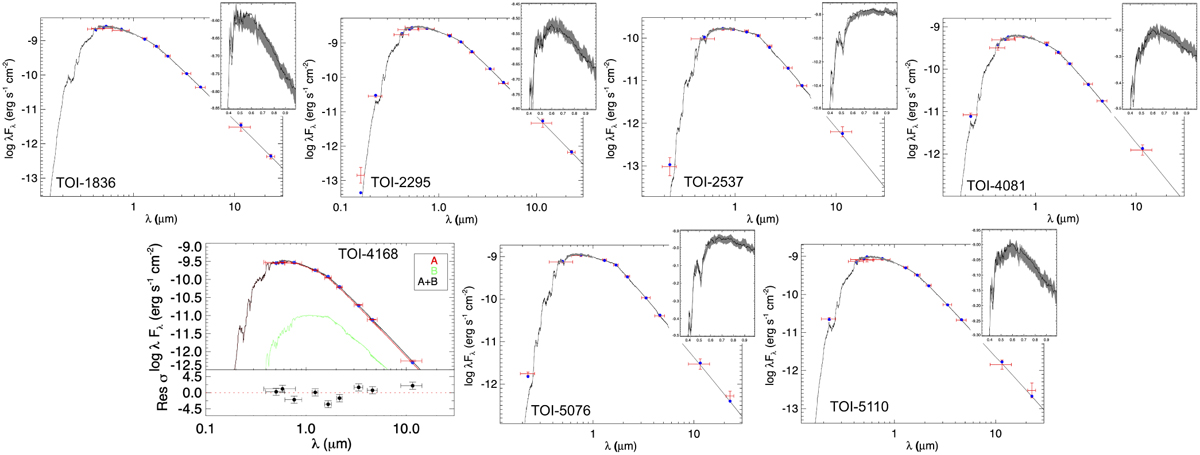
Fig. 4
Download original image
Spectral energy distributions for TOI-1836, TOI-2295, TOI-2537, TOI-4081, TOI-4168, TOI-5076, and TOI-5110. The stars’ names are indicated on each panel. All SED analyses were performed following the methodology presented in Sect. 3, except for TOI-4168, which is detailed in Sect. 4.4. The red symbols represent the observed photometric measurements, and the horizontal bars represent the effective width of the passband. Blue symbols are the model fluxes from the maximum a posteriori PHOENIX atmosphere model (black). The inset shows the absolute flux-calibrated Gaia low-resolution spectrum as a gray swathe overlaid on the model (black).
Current usage metrics show cumulative count of Article Views (full-text article views including HTML views, PDF and ePub downloads, according to the available data) and Abstracts Views on Vision4Press platform.
Data correspond to usage on the plateform after 2015. The current usage metrics is available 48-96 hours after online publication and is updated daily on week days.
Initial download of the metrics may take a while.