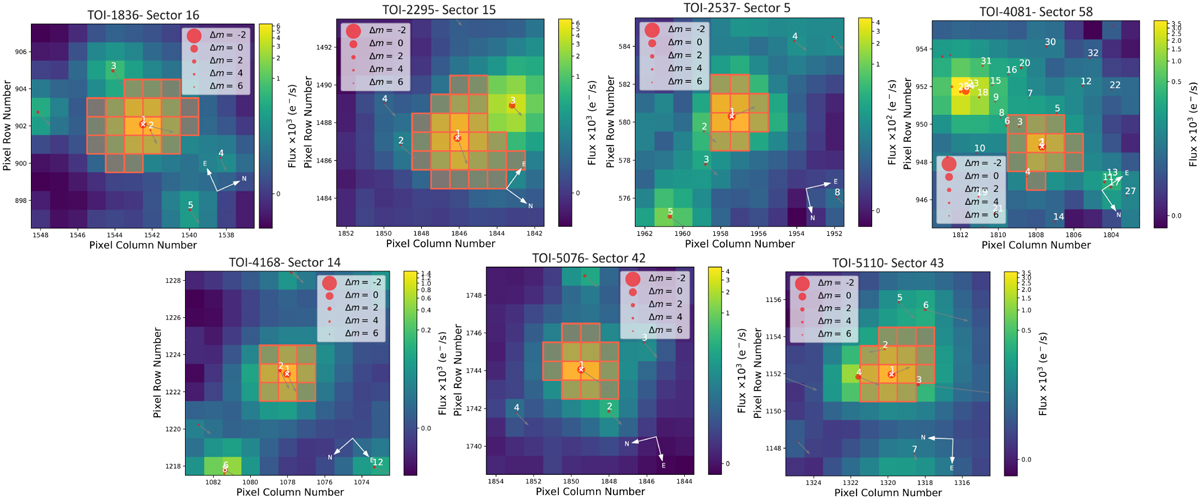
Fig. 2
Download original image
Target pixel file images from the first observed TESS sector for the seven targets in our analysis, created by tpfplotter (Aller et al. 2020). The images depict electron counts, with red-contoured pixels marking the SPOC aperture mask. Additionally, red circles highlight the primary target (numbered as 1) and nearby sources (rest of the numbers) at their Gaia DR3 positions. The area of these circles reflects the relative magnitudes of the sources in comparison to the target star. Arrows represent the proper motion of each star.
Current usage metrics show cumulative count of Article Views (full-text article views including HTML views, PDF and ePub downloads, according to the available data) and Abstracts Views on Vision4Press platform.
Data correspond to usage on the plateform after 2015. The current usage metrics is available 48-96 hours after online publication and is updated daily on week days.
Initial download of the metrics may take a while.