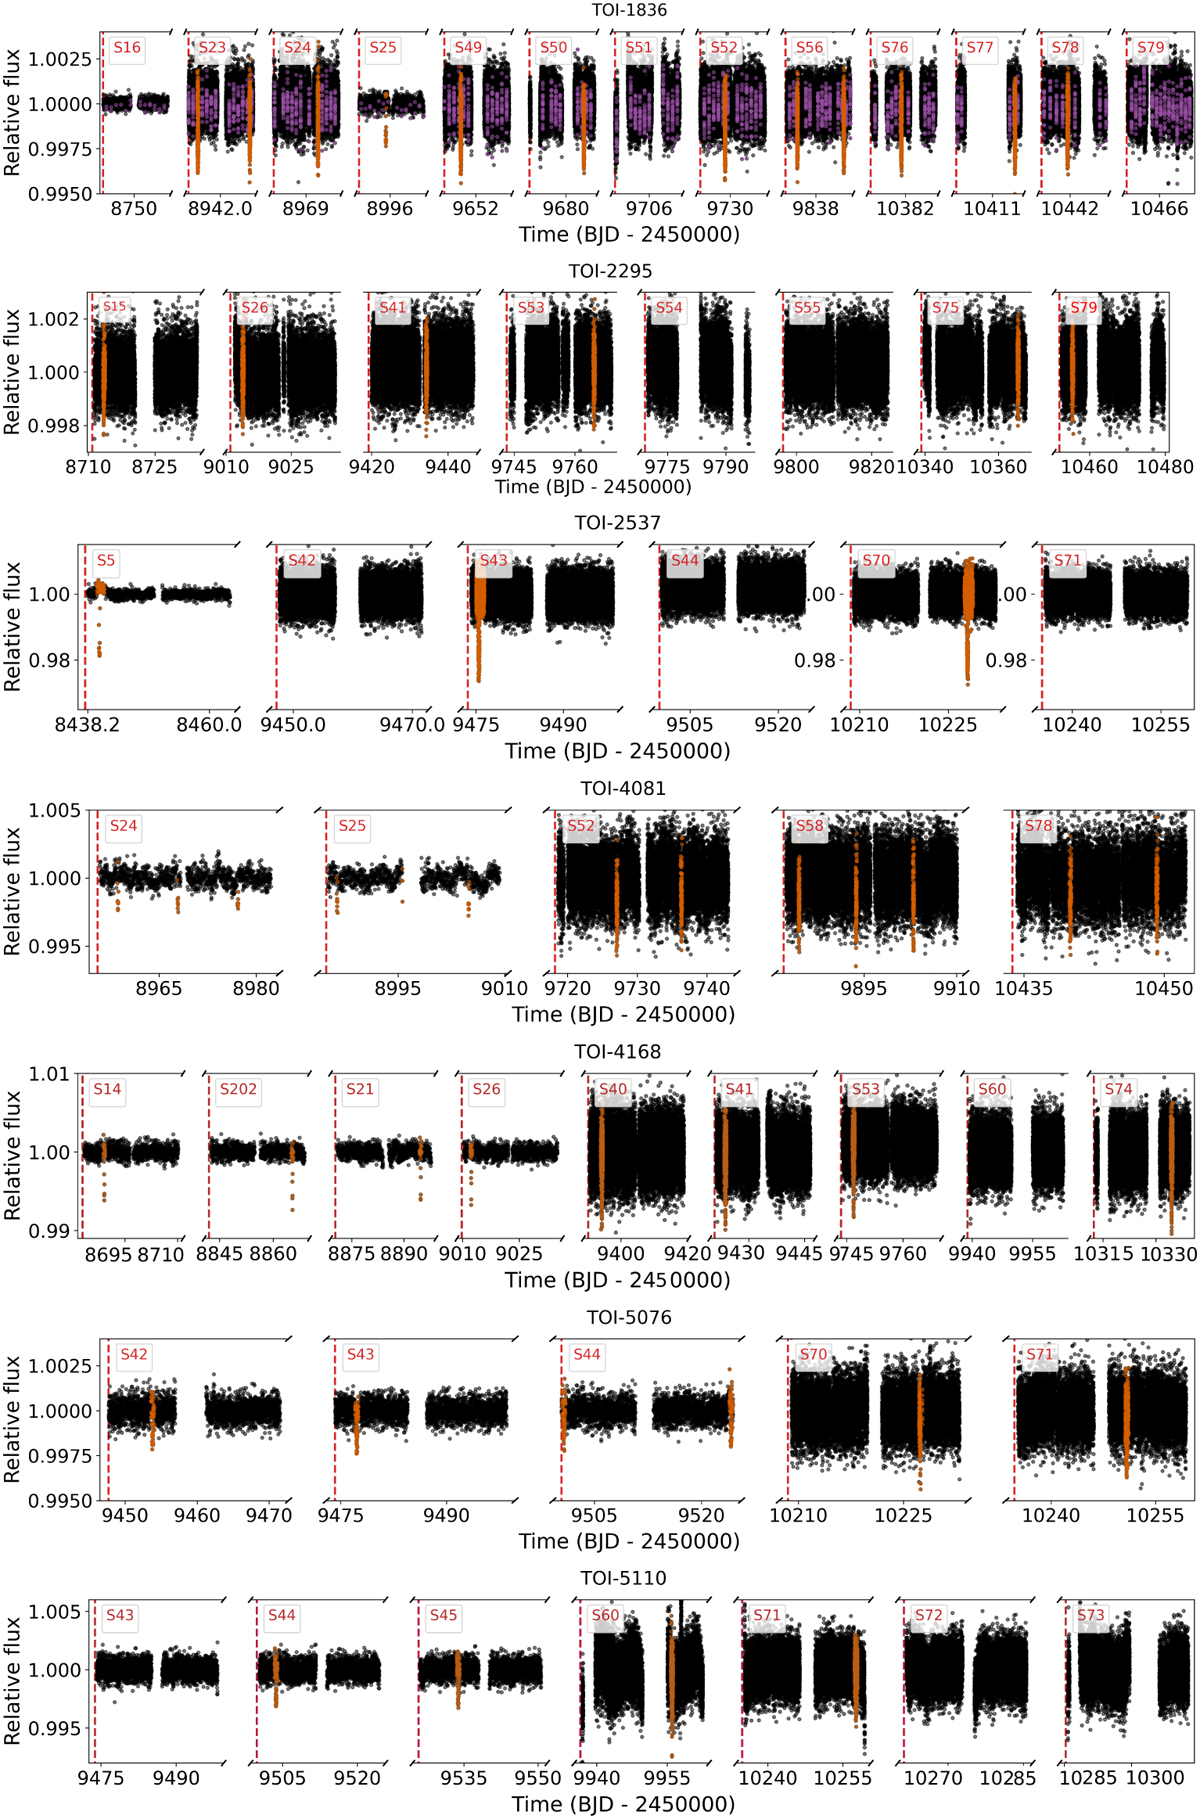
Fig. 1
Download original image
TESS PDC-SAP light curves for the seven stars analyzed in this paper. Vertical dashed red lines denote the start of individual TESS sectors, labeled by their respective sector number. Data points during transits are highlighted in orange for the first planet candidate and in purple for the second planet candidate (if present).
Current usage metrics show cumulative count of Article Views (full-text article views including HTML views, PDF and ePub downloads, according to the available data) and Abstracts Views on Vision4Press platform.
Data correspond to usage on the plateform after 2015. The current usage metrics is available 48-96 hours after online publication and is updated daily on week days.
Initial download of the metrics may take a while.