Open Access
Fig. 8.
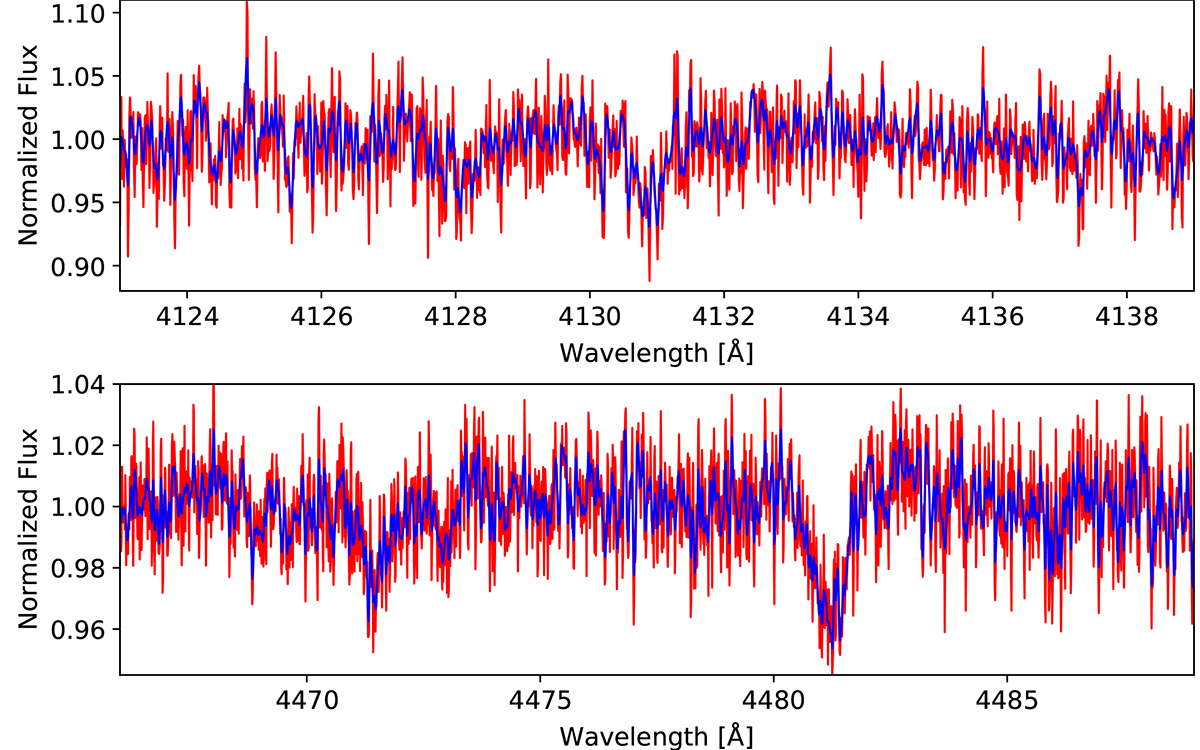
Download original image
Selected regions of the reconstructed spectrum B for the detection of the secondary component in HD 96118: Si II lines (top) and Fe II and Mg II lines (bottom). Original data are plotted in red, and a smoothed version is plotted in blue for better visibility.
Current usage metrics show cumulative count of Article Views (full-text article views including HTML views, PDF and ePub downloads, according to the available data) and Abstracts Views on Vision4Press platform.
Data correspond to usage on the plateform after 2015. The current usage metrics is available 48-96 hours after online publication and is updated daily on week days.
Initial download of the metrics may take a while.