Open Access
Fig. 4.
Download original image
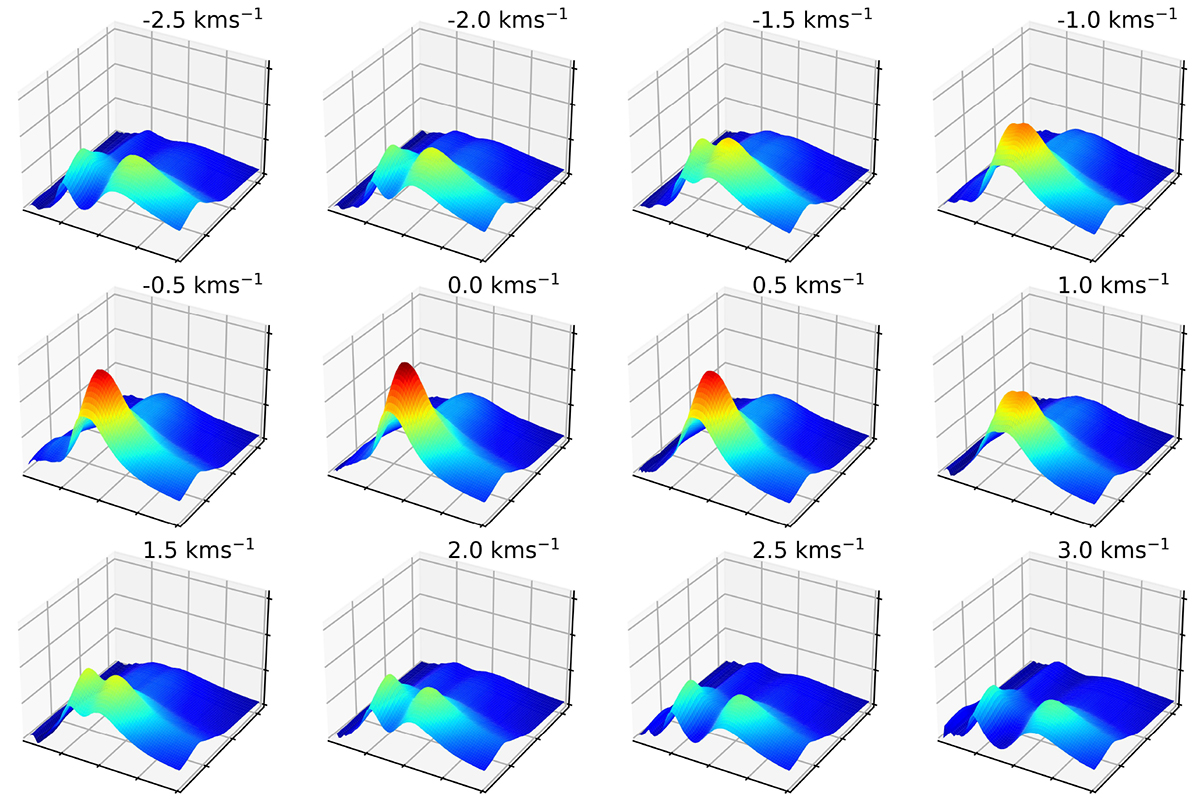
3D density plot for ℱ(q, Teff) for increasing values of the systemic velocities from γmin = −2.5 km s−1 on the top left to γmax = 3.0 km s−1 on the bottom right, in steps of 0.5 km s−1. The best solution is γ = 0 km s−1.
Current usage metrics show cumulative count of Article Views (full-text article views including HTML views, PDF and ePub downloads, according to the available data) and Abstracts Views on Vision4Press platform.
Data correspond to usage on the plateform after 2015. The current usage metrics is available 48-96 hours after online publication and is updated daily on week days.
Initial download of the metrics may take a while.