Fig. 6
Download original image
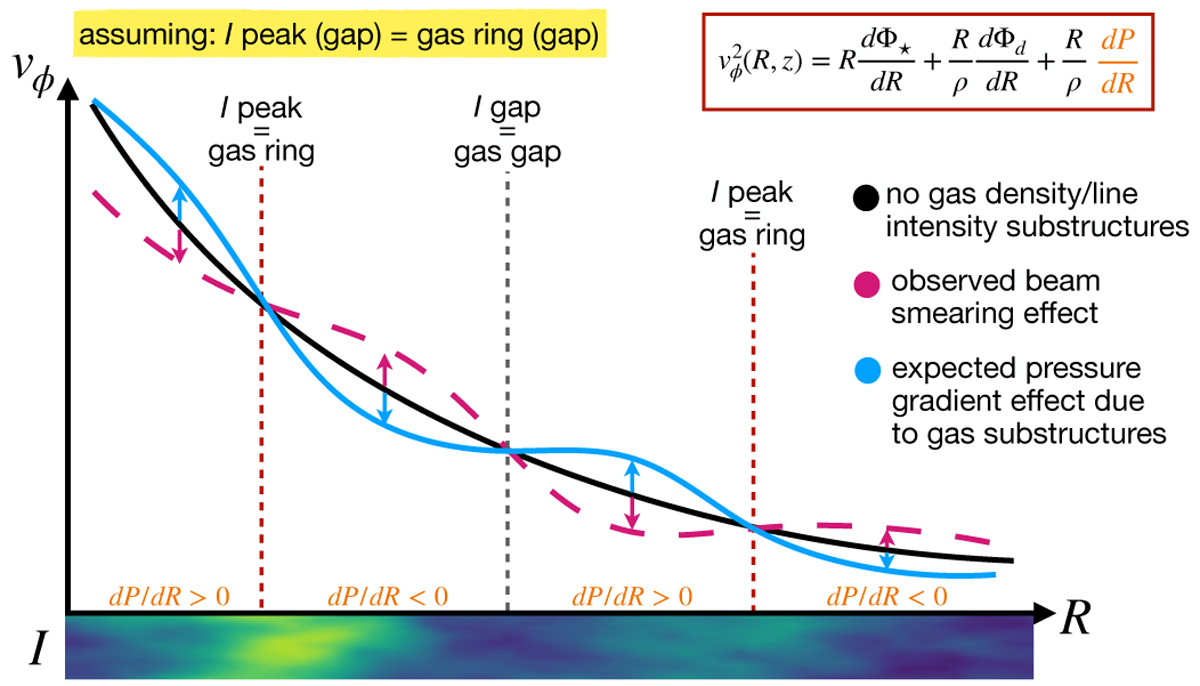
Sketch of the different effects that beam smearing due to line intensity gradients (pink dashed line) and additional pressure gradient effects due to the presence of gas density substructures (light blue solid line) have on a standard rotation curve (black solid line). We assume that intensity gradients trace gas density gradients; a peak or gap in line intensity corresponds to a peak or gap in gas density. Line intensity and gas density peaks are marked with dashed red lines, and line intensity and gas density gaps are highlighted with a dashed grey line. At the bottom we show a colored map of the radial intensity. The solid black line represents the rotation curve of a molecule showing no gas density or line intensity substructures. The typical curve distortion due to beam smearing effect is shown by the pink dashed line, and is in agreement with our observations. The expected distortion of the curve due to the presence of gas density substructures is shown by the light blue solid line. The rings and gaps in the gas density induce additional pressure gradients that influence the rotation curve, according to the ![]() expression shown in the upper right corner. These pressure gradients are positive before rings and beyond gaps locations, while they are negative before gaps and beyond rings locations. Thus, in this case, the deviations in rotational velocity are expected to be in the opposite direction of the beam smearing-induced variations.
expression shown in the upper right corner. These pressure gradients are positive before rings and beyond gaps locations, while they are negative before gaps and beyond rings locations. Thus, in this case, the deviations in rotational velocity are expected to be in the opposite direction of the beam smearing-induced variations.
Current usage metrics show cumulative count of Article Views (full-text article views including HTML views, PDF and ePub downloads, according to the available data) and Abstracts Views on Vision4Press platform.
Data correspond to usage on the plateform after 2015. The current usage metrics is available 48-96 hours after online publication and is updated daily on week days.
Initial download of the metrics may take a while.