Fig. 5
Download original image
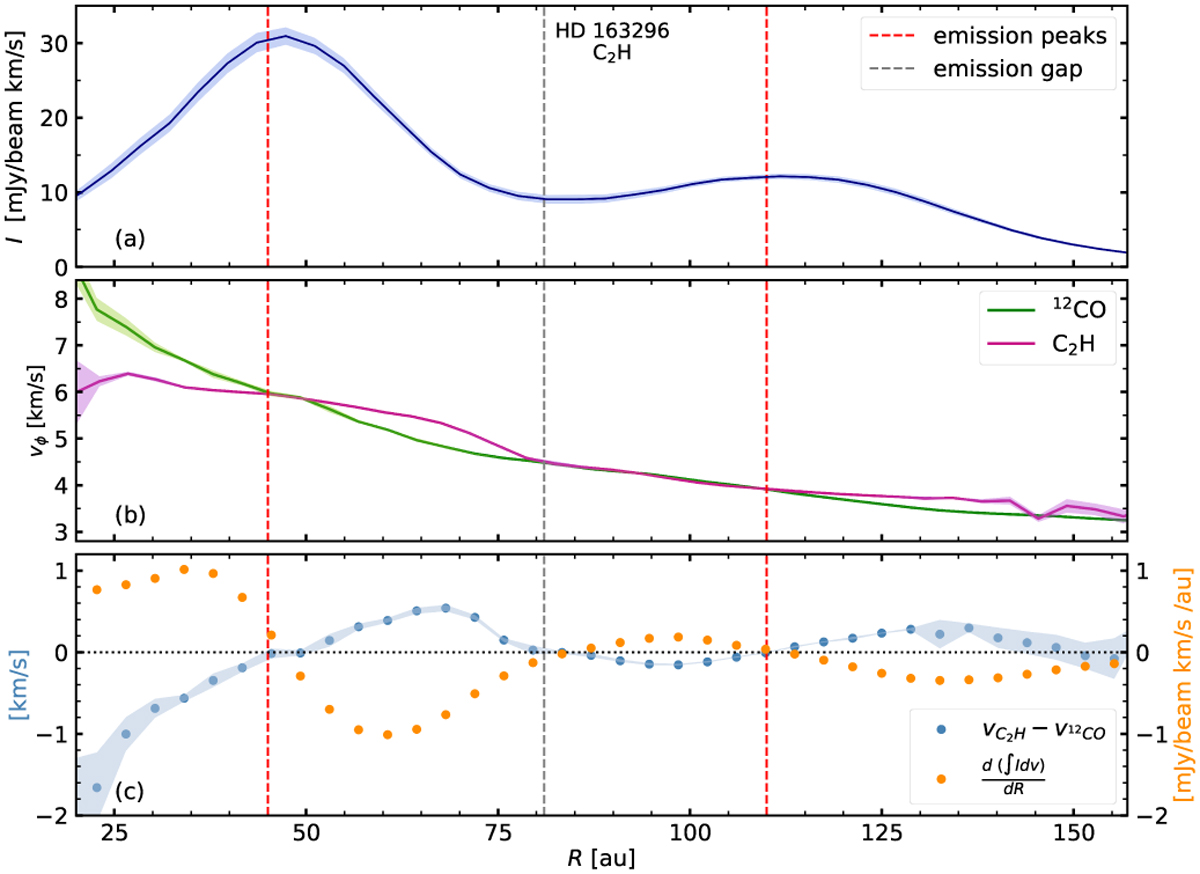
Beam smearing effect for C2H. Panel a: azimuthally averaged integrated intensity profile of the C2H line. Emission peaks are marked with dashed red lines and the emission gap is highlighted with a dashed grey line. Panel b: rotation curve of C2H (purple line) compared to that of 12CO (green line). The rotation velocity of C2H is super-Keplerian just before the gap and sub-Keplerian after. It shows the opposite behavior in correspondence of the emission peaks. Panel c: anticorrelation between the C2H integrated intensity gradient and its difference in rotation velocity compared to 12CO. The two quantities show an opposite modulation, and they cross at the radii corresponding to the emission gap or peaks.
Current usage metrics show cumulative count of Article Views (full-text article views including HTML views, PDF and ePub downloads, according to the available data) and Abstracts Views on Vision4Press platform.
Data correspond to usage on the plateform after 2015. The current usage metrics is available 48-96 hours after online publication and is updated daily on week days.
Initial download of the metrics may take a while.