Open Access
Fig. 3
Download original image
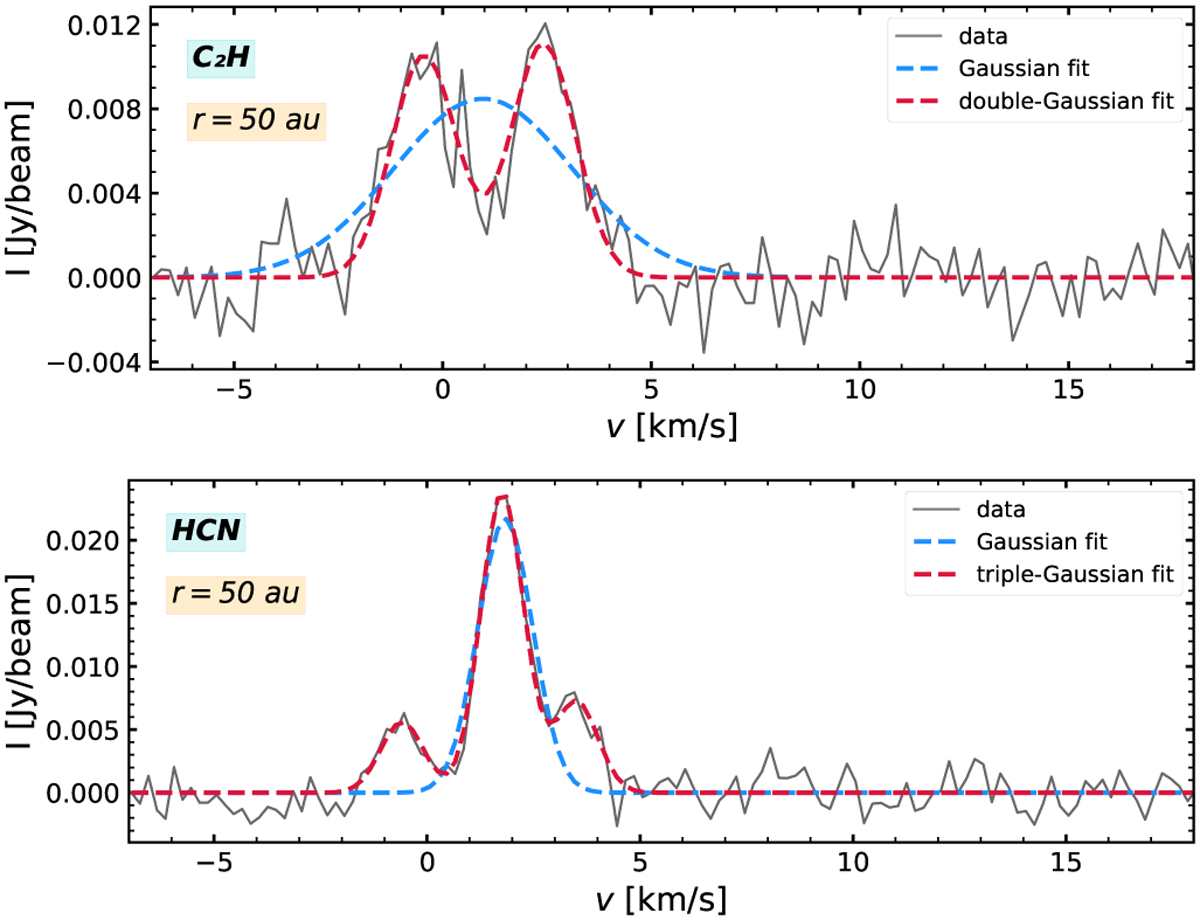
Improvement in the fitting of the spectra using multi-Gaussian methods. Top panel: comparison between the single-Gaussian (light blue) and the double-Gaussian (pink) methods used to fit the intensity peaks of C2H at 50 au. Bottom panel: same as top panel, but for the three hyperfine components of the HCN transition.
Current usage metrics show cumulative count of Article Views (full-text article views including HTML views, PDF and ePub downloads, according to the available data) and Abstracts Views on Vision4Press platform.
Data correspond to usage on the plateform after 2015. The current usage metrics is available 48-96 hours after online publication and is updated daily on week days.
Initial download of the metrics may take a while.