Open Access
Fig. 2
Download original image
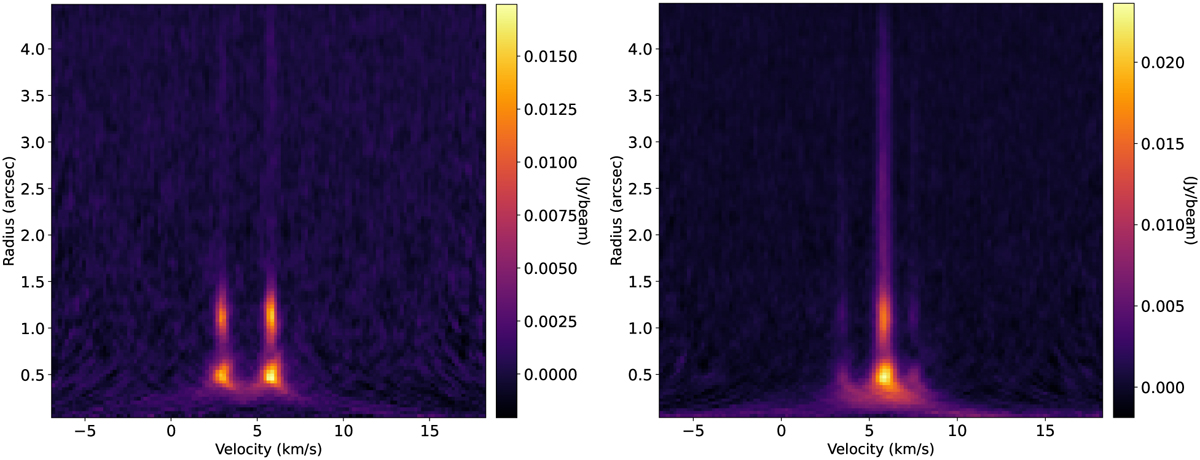
Teardrop plots for C2H (left) and HCN (right). Each row of the plot represents an averaged spectrum at separate annuli after shifting and stacking. The color scale indicates the intensity of the emission line. In both cases, hyperfine transitions (two for C2H and three for HCN) are clearly visible.
Current usage metrics show cumulative count of Article Views (full-text article views including HTML views, PDF and ePub downloads, according to the available data) and Abstracts Views on Vision4Press platform.
Data correspond to usage on the plateform after 2015. The current usage metrics is available 48-96 hours after online publication and is updated daily on week days.
Initial download of the metrics may take a while.