Open Access
Fig. D.1
Download original image
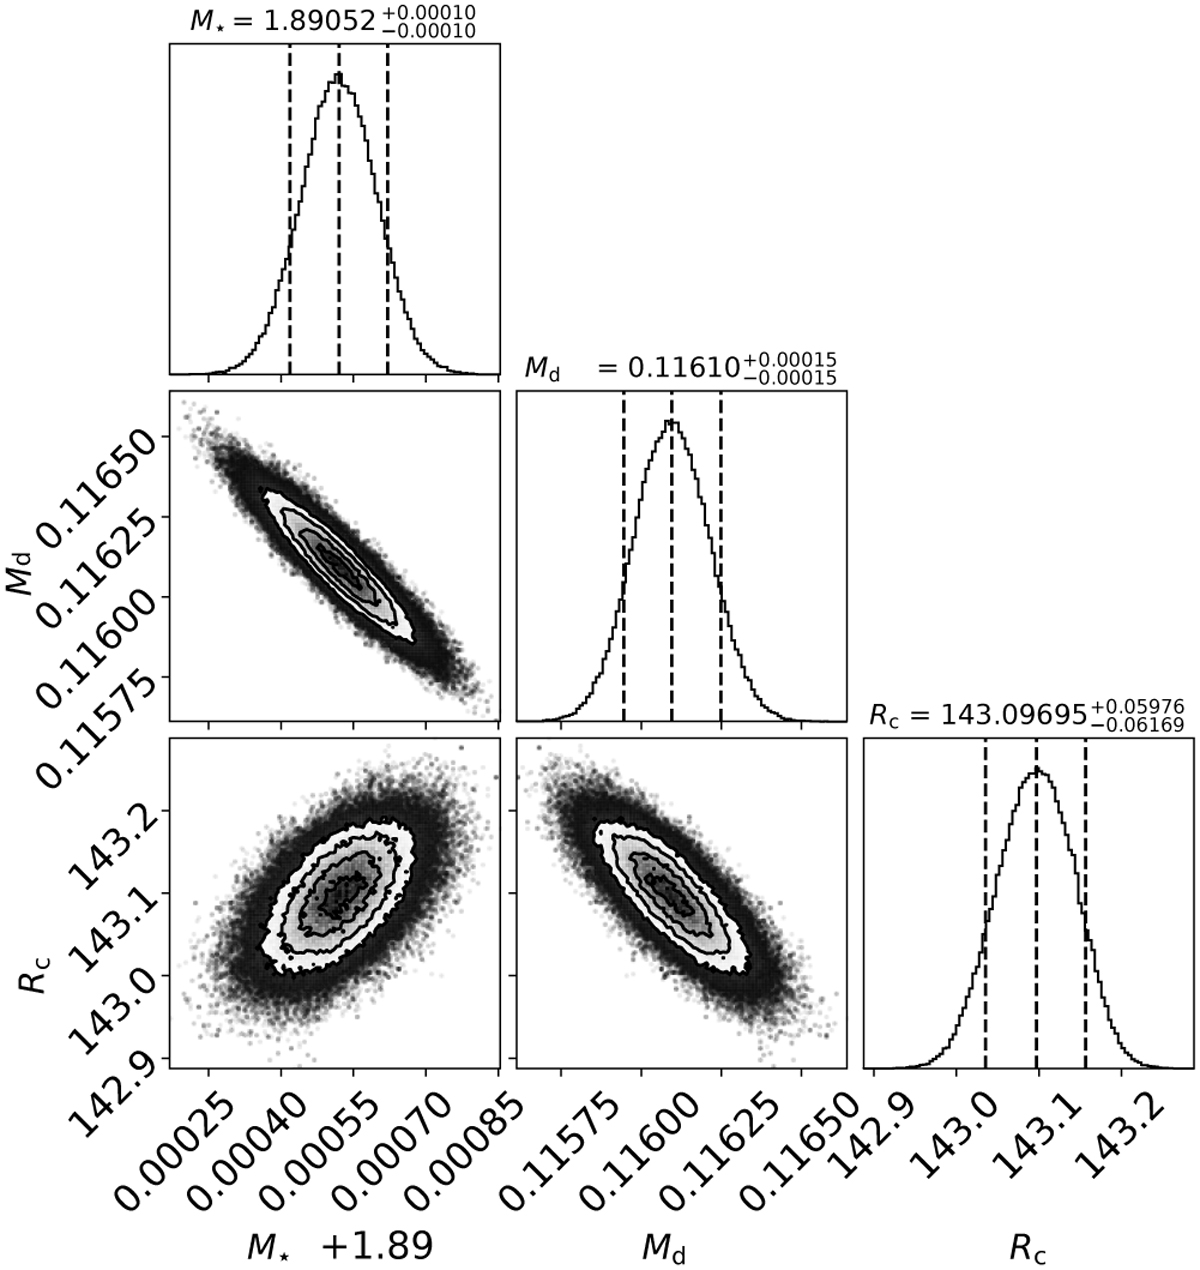
Corner plot of the multi-molecule stratified fit performed with DySc on the seven considered rotation curves. The uncertainties reported in the plot represent the default errors we obtain from the MCMC process, not the one we consider for our analysis, as explained in Sect. 4.1.
Current usage metrics show cumulative count of Article Views (full-text article views including HTML views, PDF and ePub downloads, according to the available data) and Abstracts Views on Vision4Press platform.
Data correspond to usage on the plateform after 2015. The current usage metrics is available 48-96 hours after online publication and is updated daily on week days.
Initial download of the metrics may take a while.