Fig. 2
Download original image
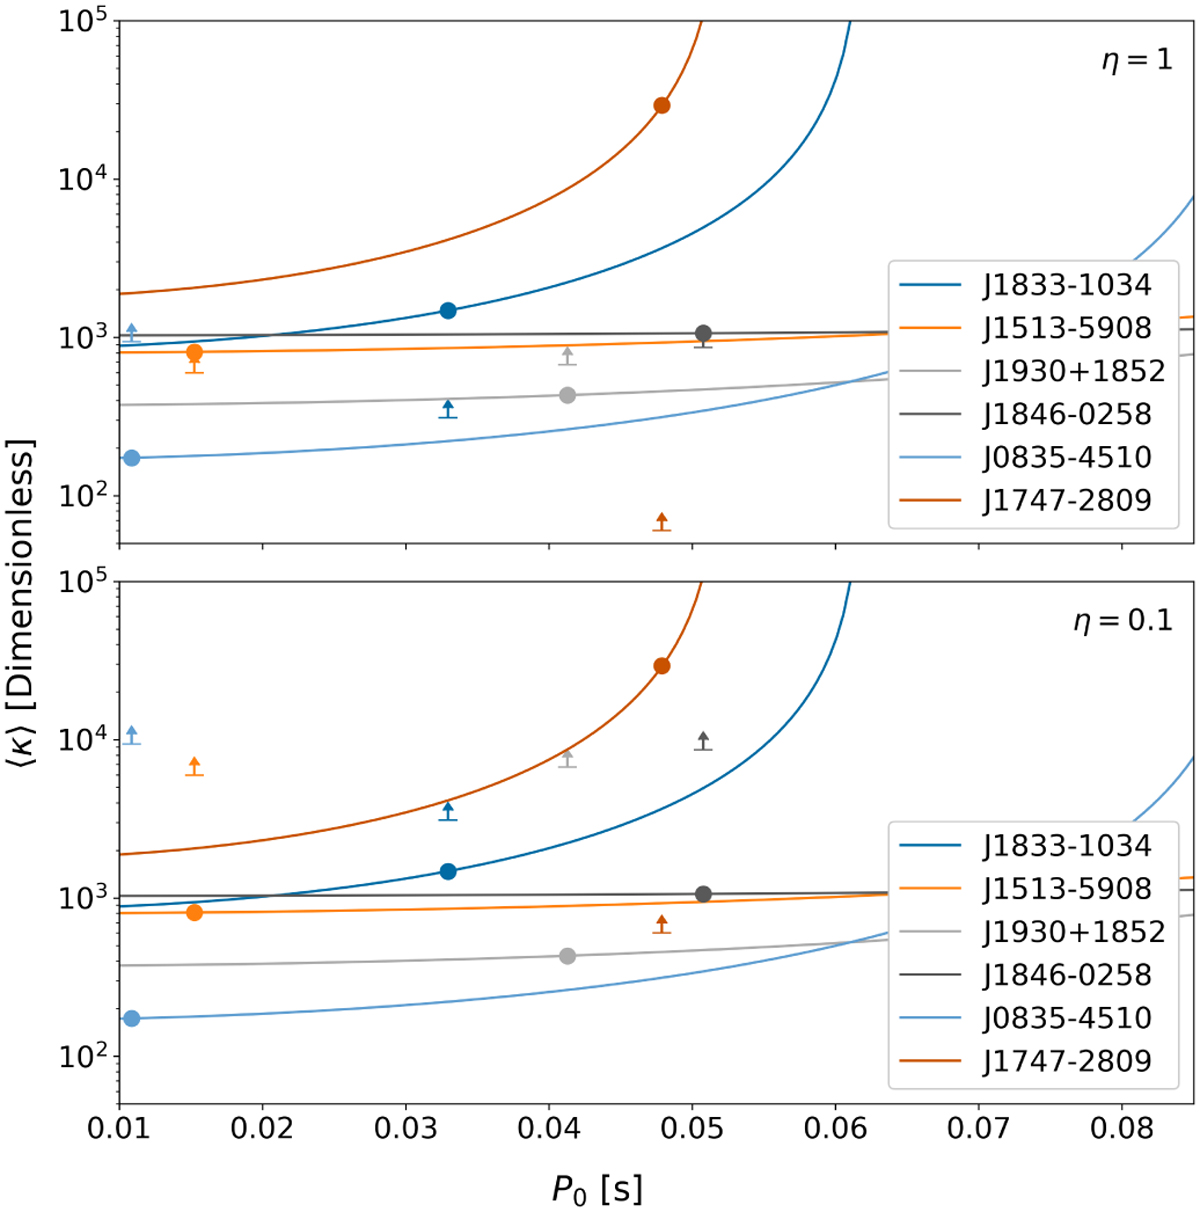
Intersections of our estimates for P0 using Eq. (2), and the curves of ⟨κ⟩(P0) as estimated using Eqs. (3), (6), and (7) (the latter is constrained such that P0 < Pt) are shown by circular markers. The intersection location represents the lower limit for the pair-production multiplicity (see Table 3) for the associated values. Derived values for the pair-production multiplicity limit ⟨κ⟩lim for each pulsar are shown as lower limit markers in matching colours to the multiplicity curve. The top panel assumes a luminosity conversion efficiency of η = 1 in the determination of ⟨κ⟩lim, whereas the lower panel assumes η = 0.1.
Current usage metrics show cumulative count of Article Views (full-text article views including HTML views, PDF and ePub downloads, according to the available data) and Abstracts Views on Vision4Press platform.
Data correspond to usage on the plateform after 2015. The current usage metrics is available 48-96 hours after online publication and is updated daily on week days.
Initial download of the metrics may take a while.