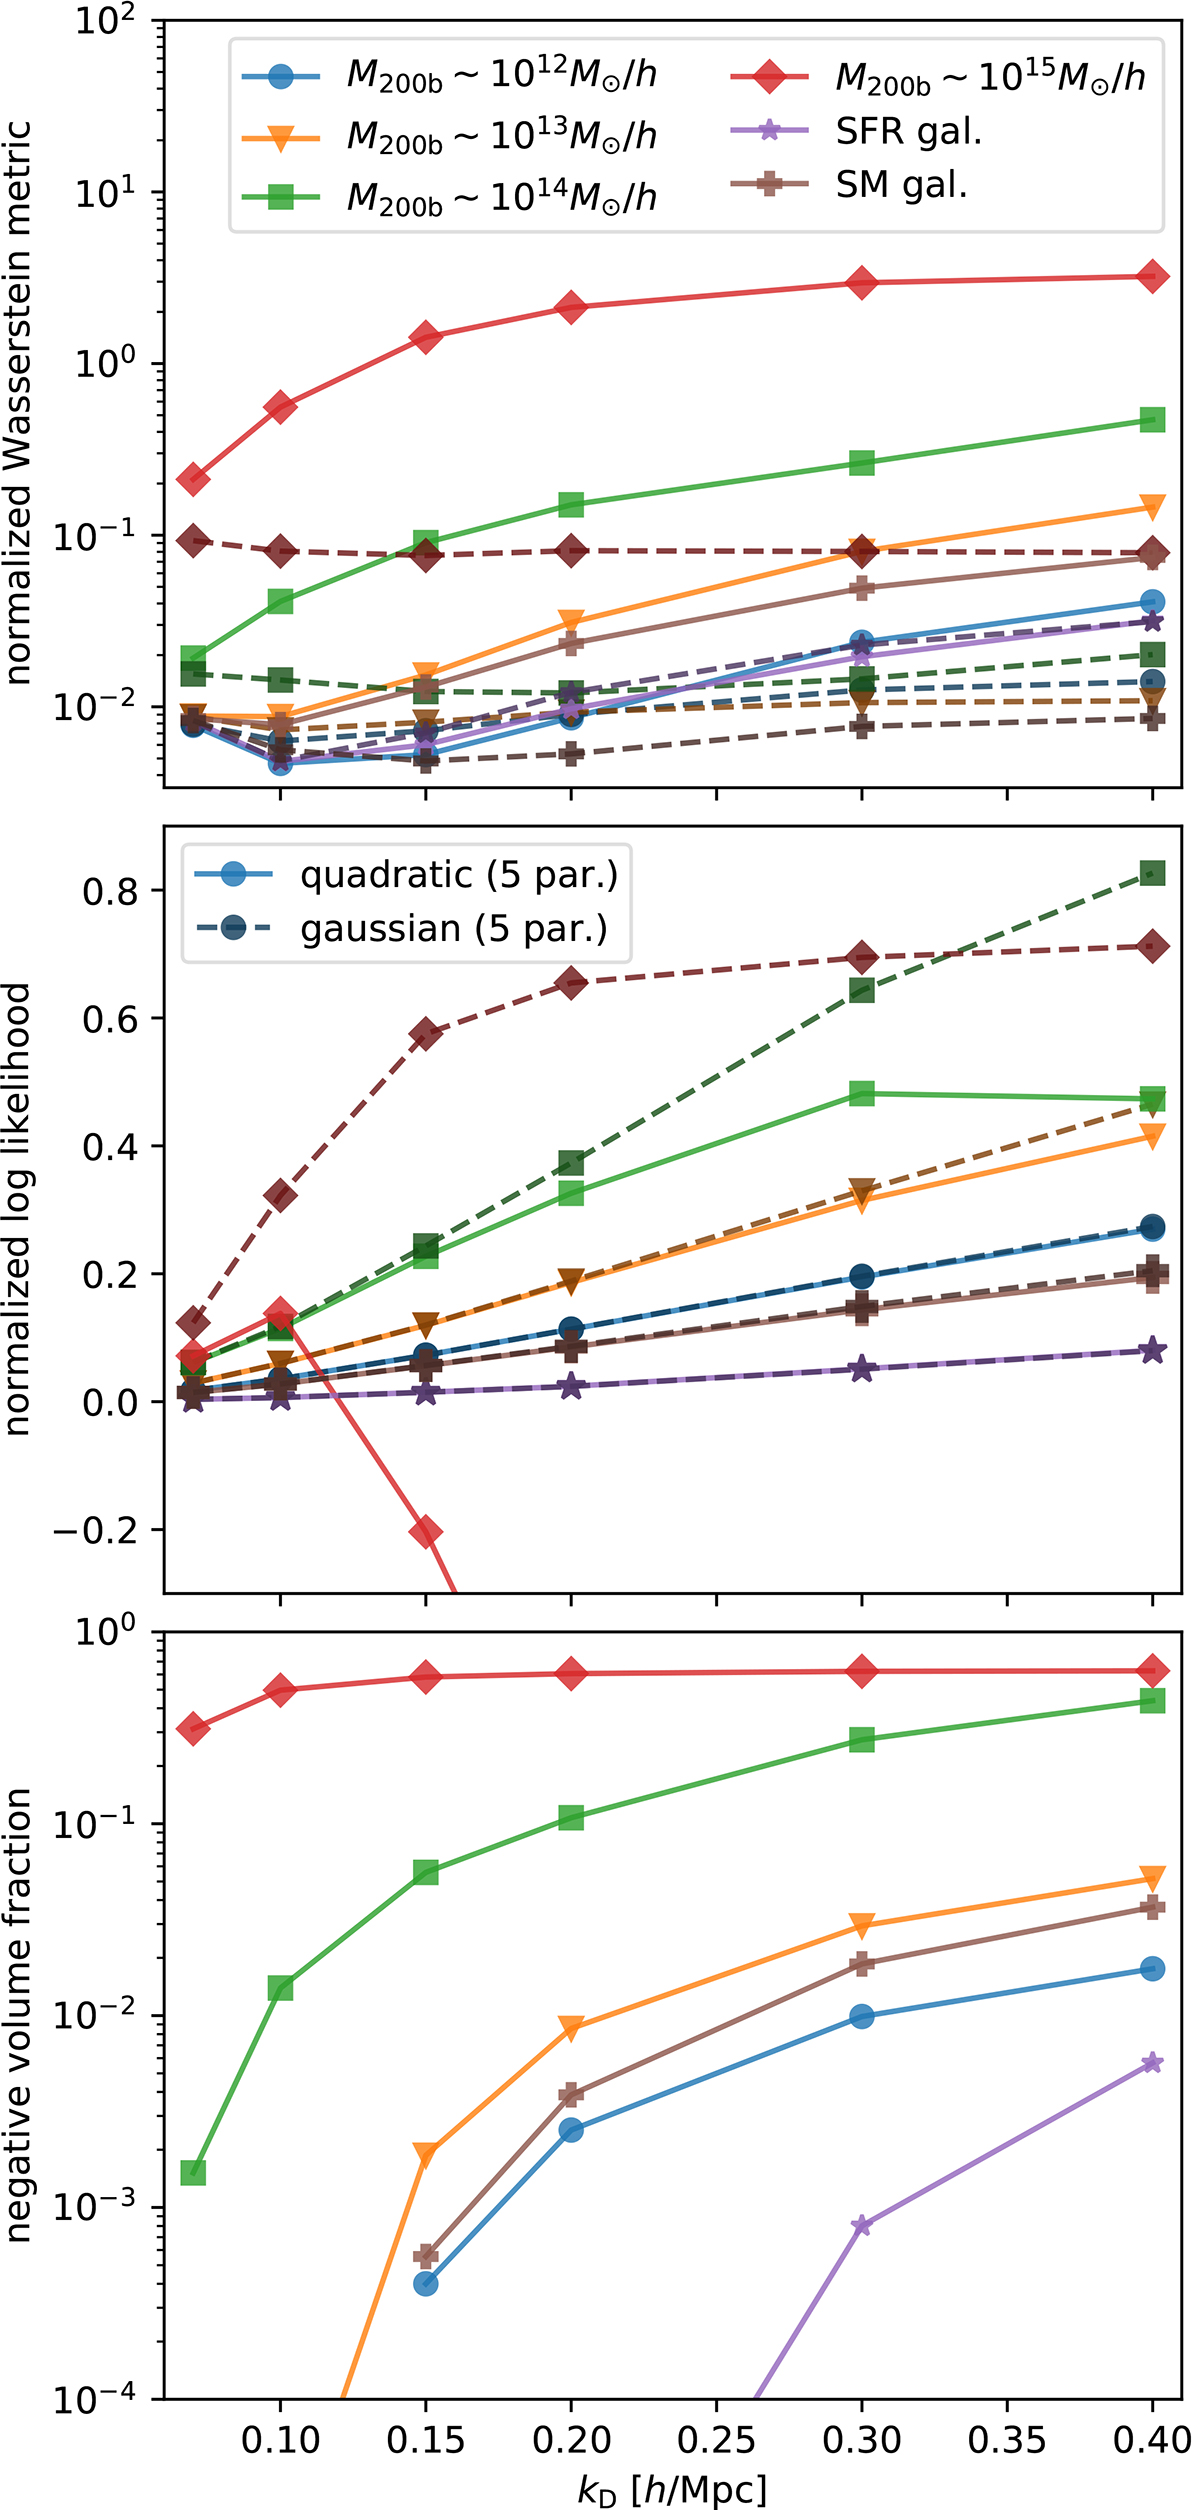
Fig. 6.
Download original image
Metrics for evaluating the performance of the different bias models in the multi-variate case. The top panel shows the Wasserstein metric (smaller is better), the central panel the normalised log likelihood (larger is better) and the bottom panel the fraction of volume for which negative galaxy densities are predicted. Generally, the multi-variate Gaussian bias model appears to describe the data either significantly better or at least equally well to a quadratic bias model and it never predicts negative galaxy densities, which can get quite significant for the expansion bias.
Current usage metrics show cumulative count of Article Views (full-text article views including HTML views, PDF and ePub downloads, according to the available data) and Abstracts Views on Vision4Press platform.
Data correspond to usage on the plateform after 2015. The current usage metrics is available 48-96 hours after online publication and is updated daily on week days.
Initial download of the metrics may take a while.