Fig. 5.
Download original image
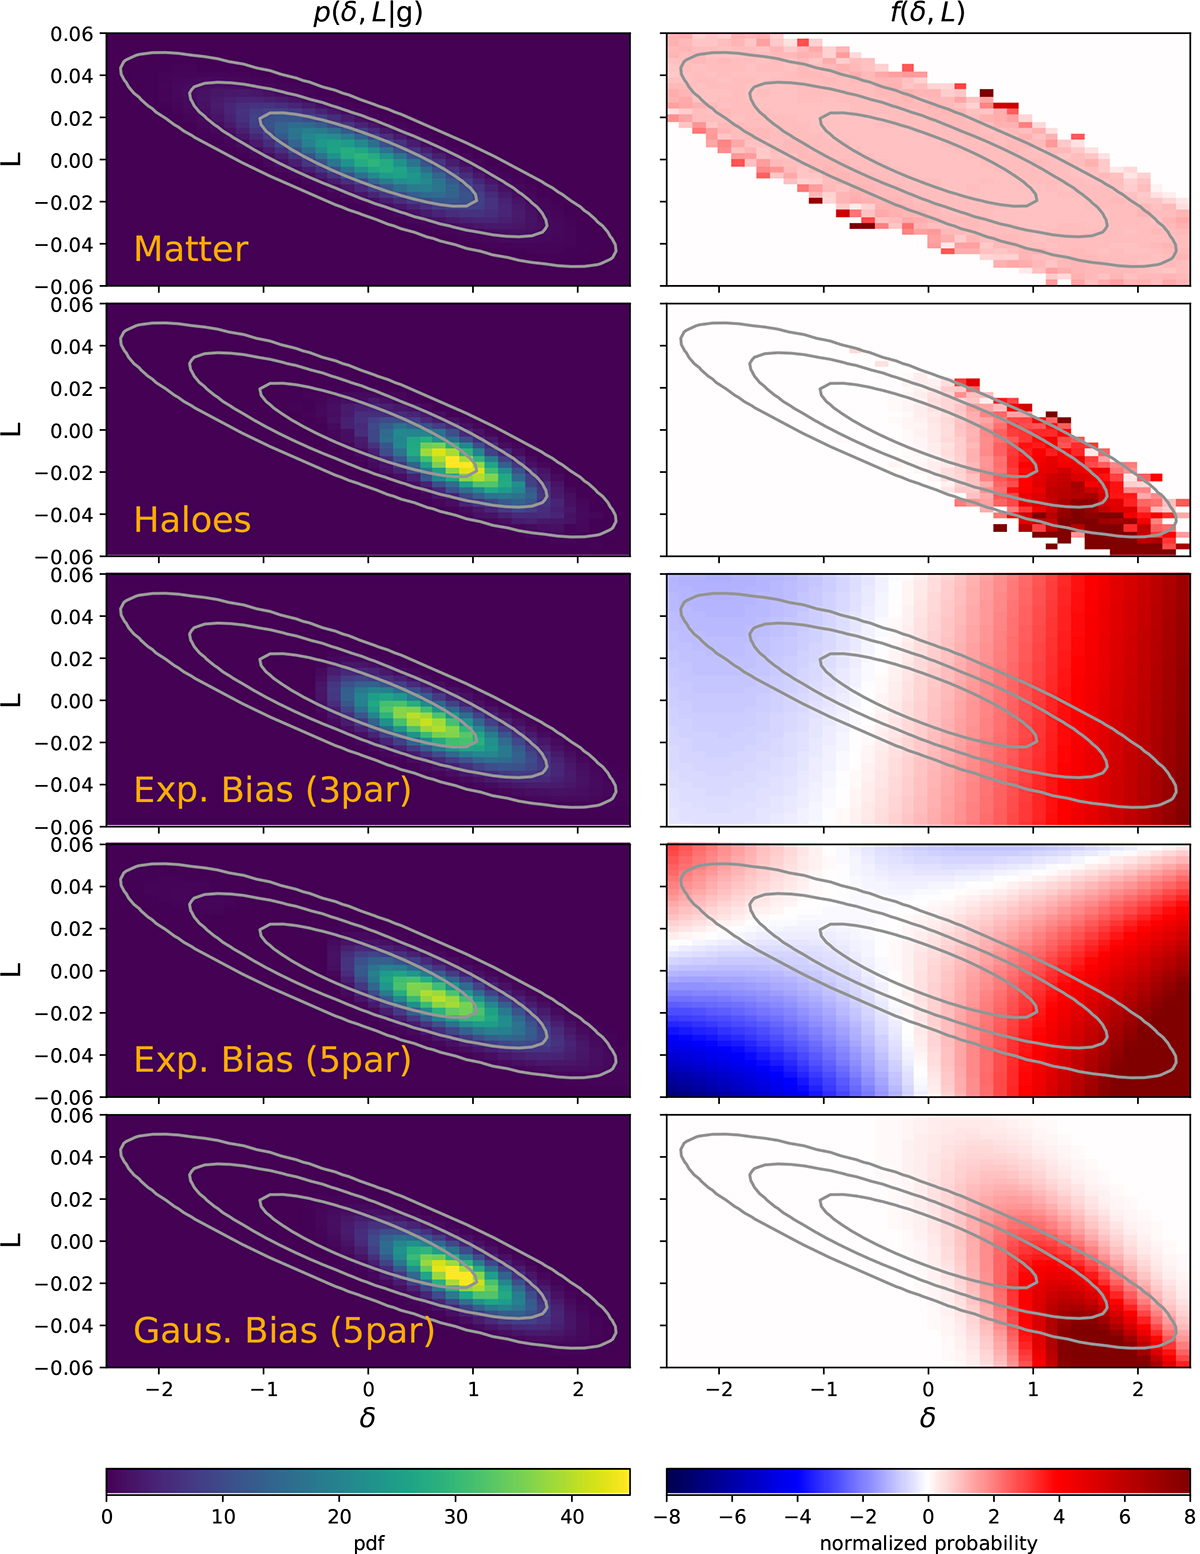
Distribution of Lagrangian over-densities, δ, and the Laplacian, L (in units of h2 Mpc−2) p(δ, L|g) (left), and the multi-variate bias function (right). The top row shows the distribution for matter particles for kd = 0.2 h Mpc−1 and the second row of haloes selected in the mass-range M200b ∼ 2 × 10¹⁴ h M⊙. The remaining rows show approximations to the halo distribution through a 3 parameter second-order expansion, a 5 parameter second-order expansion and a Gaussian bias model. The contours show the 1-,2- and 3-sigma regions of the matter distribution. The measurement for haloes has only reasonable statistics roughly inside of the 3-sigma region of the matter distribution (outermost grey contour). The multi-variate Gaussian bias seems to be a good approximation to the actual distribution and adequately respects the positivity constraint.
Current usage metrics show cumulative count of Article Views (full-text article views including HTML views, PDF and ePub downloads, according to the available data) and Abstracts Views on Vision4Press platform.
Data correspond to usage on the plateform after 2015. The current usage metrics is available 48-96 hours after online publication and is updated daily on week days.
Initial download of the metrics may take a while.