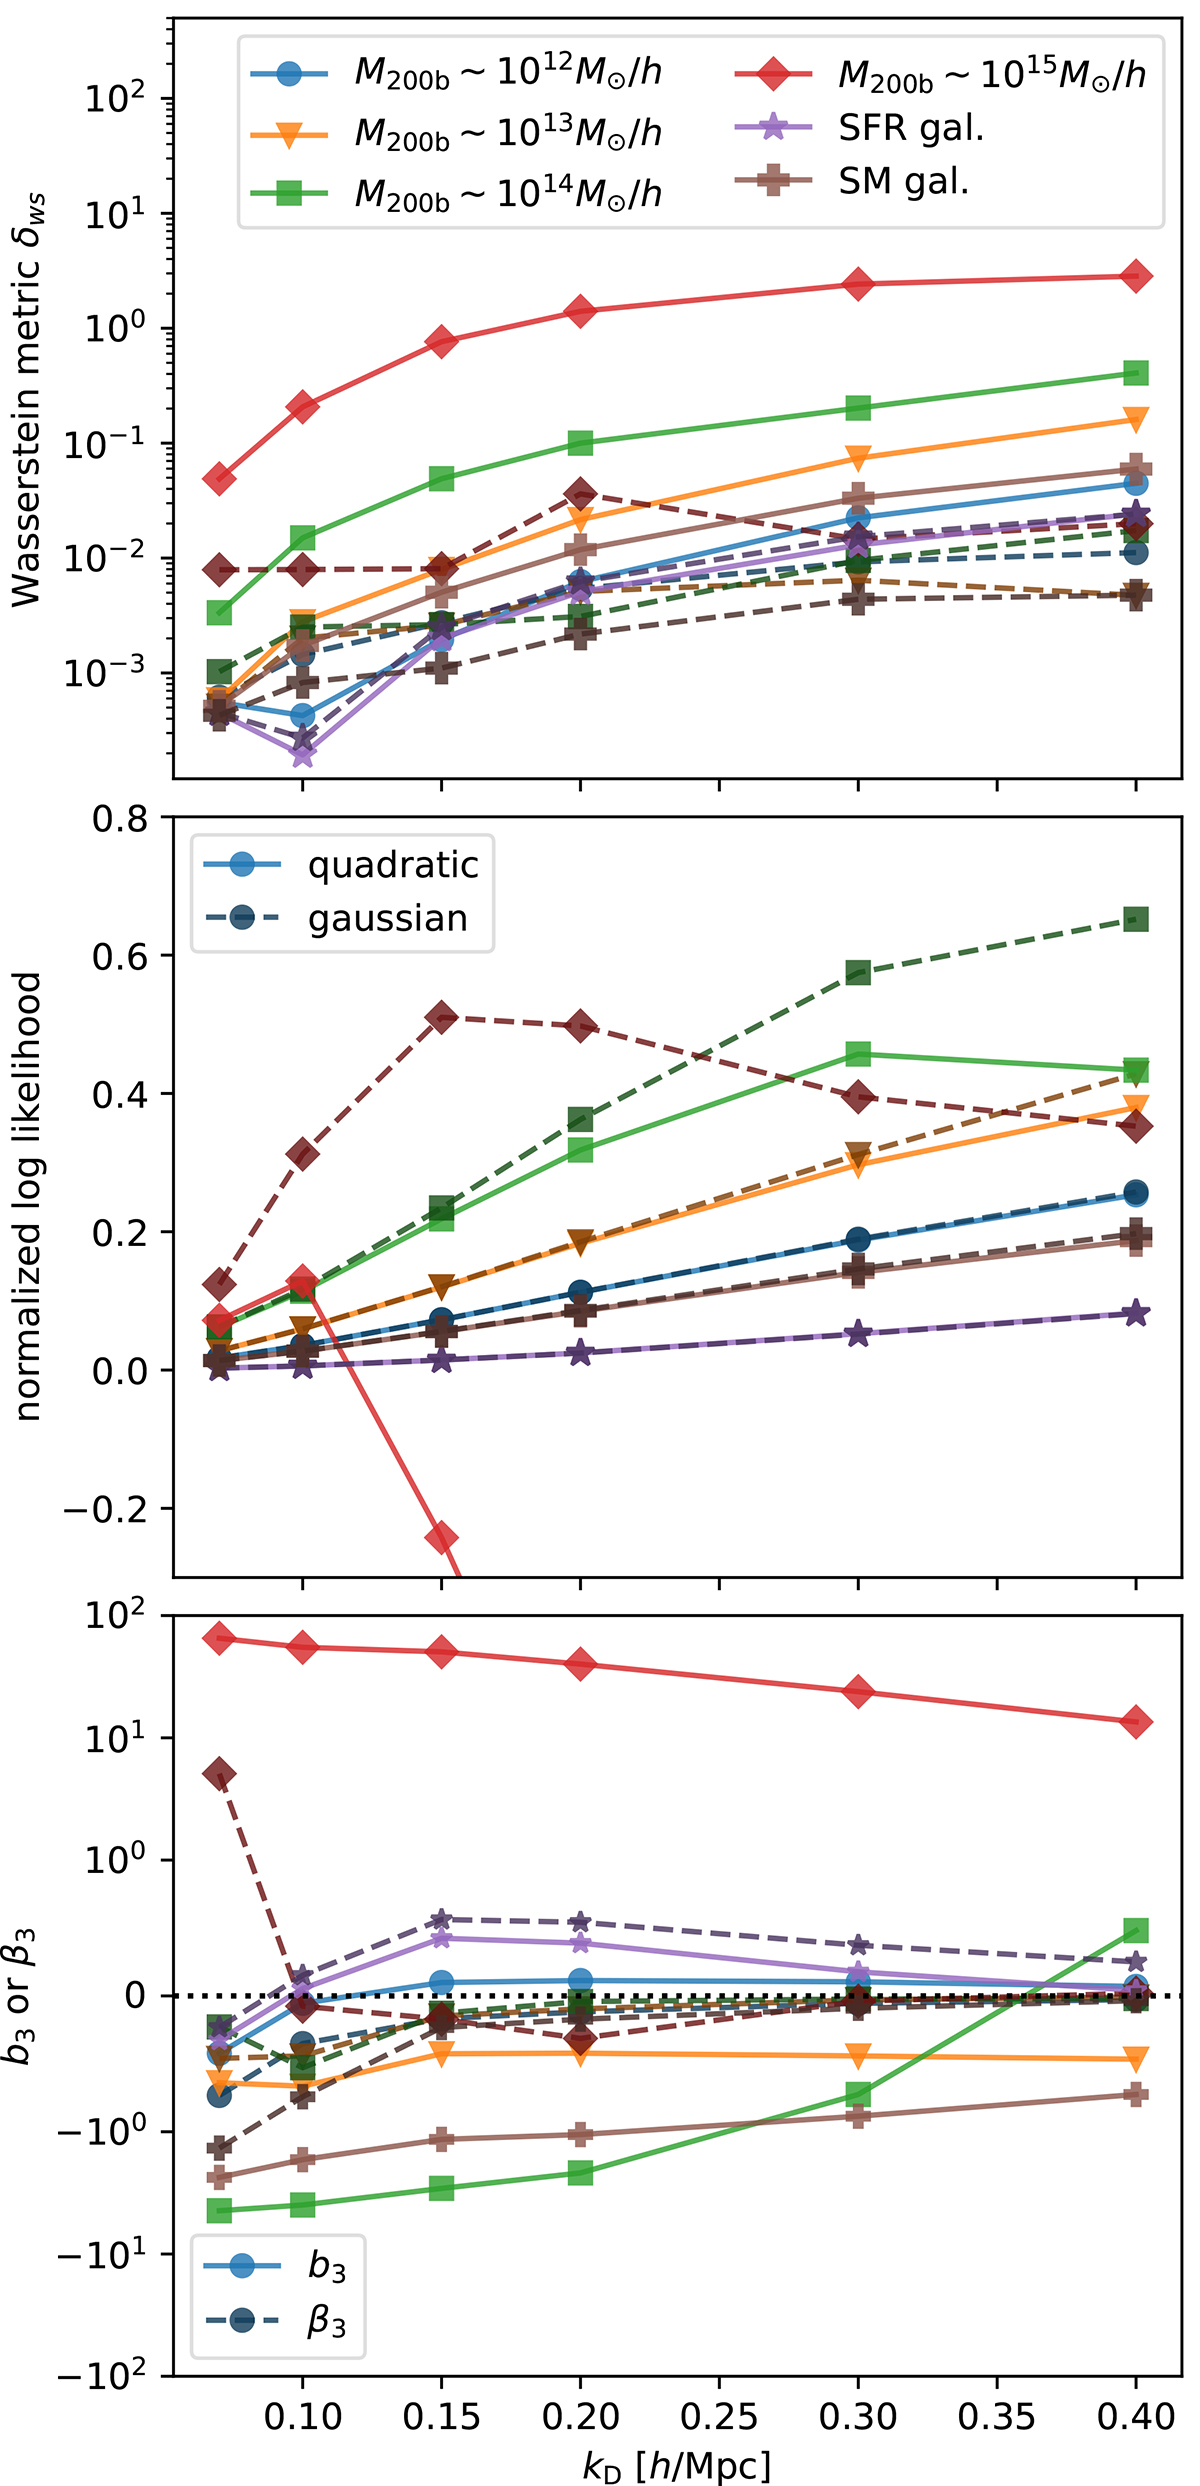
Fig. 4.
Download original image
Metrics to compare the performance of the Gaussian bias model to expansion biases. The top panel shows the Wasserstein distance between the actual and the modelled galaxy environment distribution (smaller is better), the central panel the normalised log likelihood (larger is better) and the bottom panel the amplitude of the first unmodelled term (closer to zero is better). Brighter solid lines show the quadratic bias model and darker solid lines the Gaussian bias. All metrics and selections show the Gaussian bias performing either similar to a quadratic model or significantly better.
Current usage metrics show cumulative count of Article Views (full-text article views including HTML views, PDF and ePub downloads, according to the available data) and Abstracts Views on Vision4Press platform.
Data correspond to usage on the plateform after 2015. The current usage metrics is available 48-96 hours after online publication and is updated daily on week days.
Initial download of the metrics may take a while.