Fig. 1.
Download original image
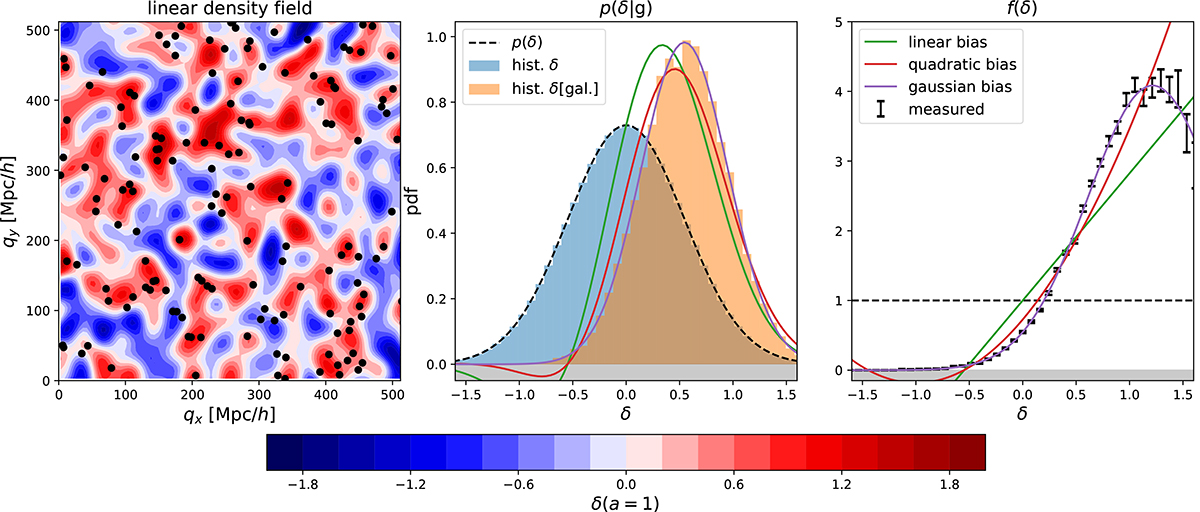
Illustration of the steps necessary for measuring the bias function, f. Left: the smoothed linear density field and the initial (Lagrangian) locations of a set of tracers – here the most bound particles of haloes with M200b ∼ 2 × 10¹⁴ h−1 M⊙. Center: Distribution of the linear densities at the tracer locations (orange histogram) which is biased relative to the distribution at random locations (blue histogram). Right: The bias function, which is inferred by dividing the orange histogram by the background distribution. The solid lines show different bias models out of which the Gaussian bias model describes the data clearly the best.
Current usage metrics show cumulative count of Article Views (full-text article views including HTML views, PDF and ePub downloads, according to the available data) and Abstracts Views on Vision4Press platform.
Data correspond to usage on the plateform after 2015. The current usage metrics is available 48-96 hours after online publication and is updated daily on week days.
Initial download of the metrics may take a while.