Fig. A.2.
Download original image
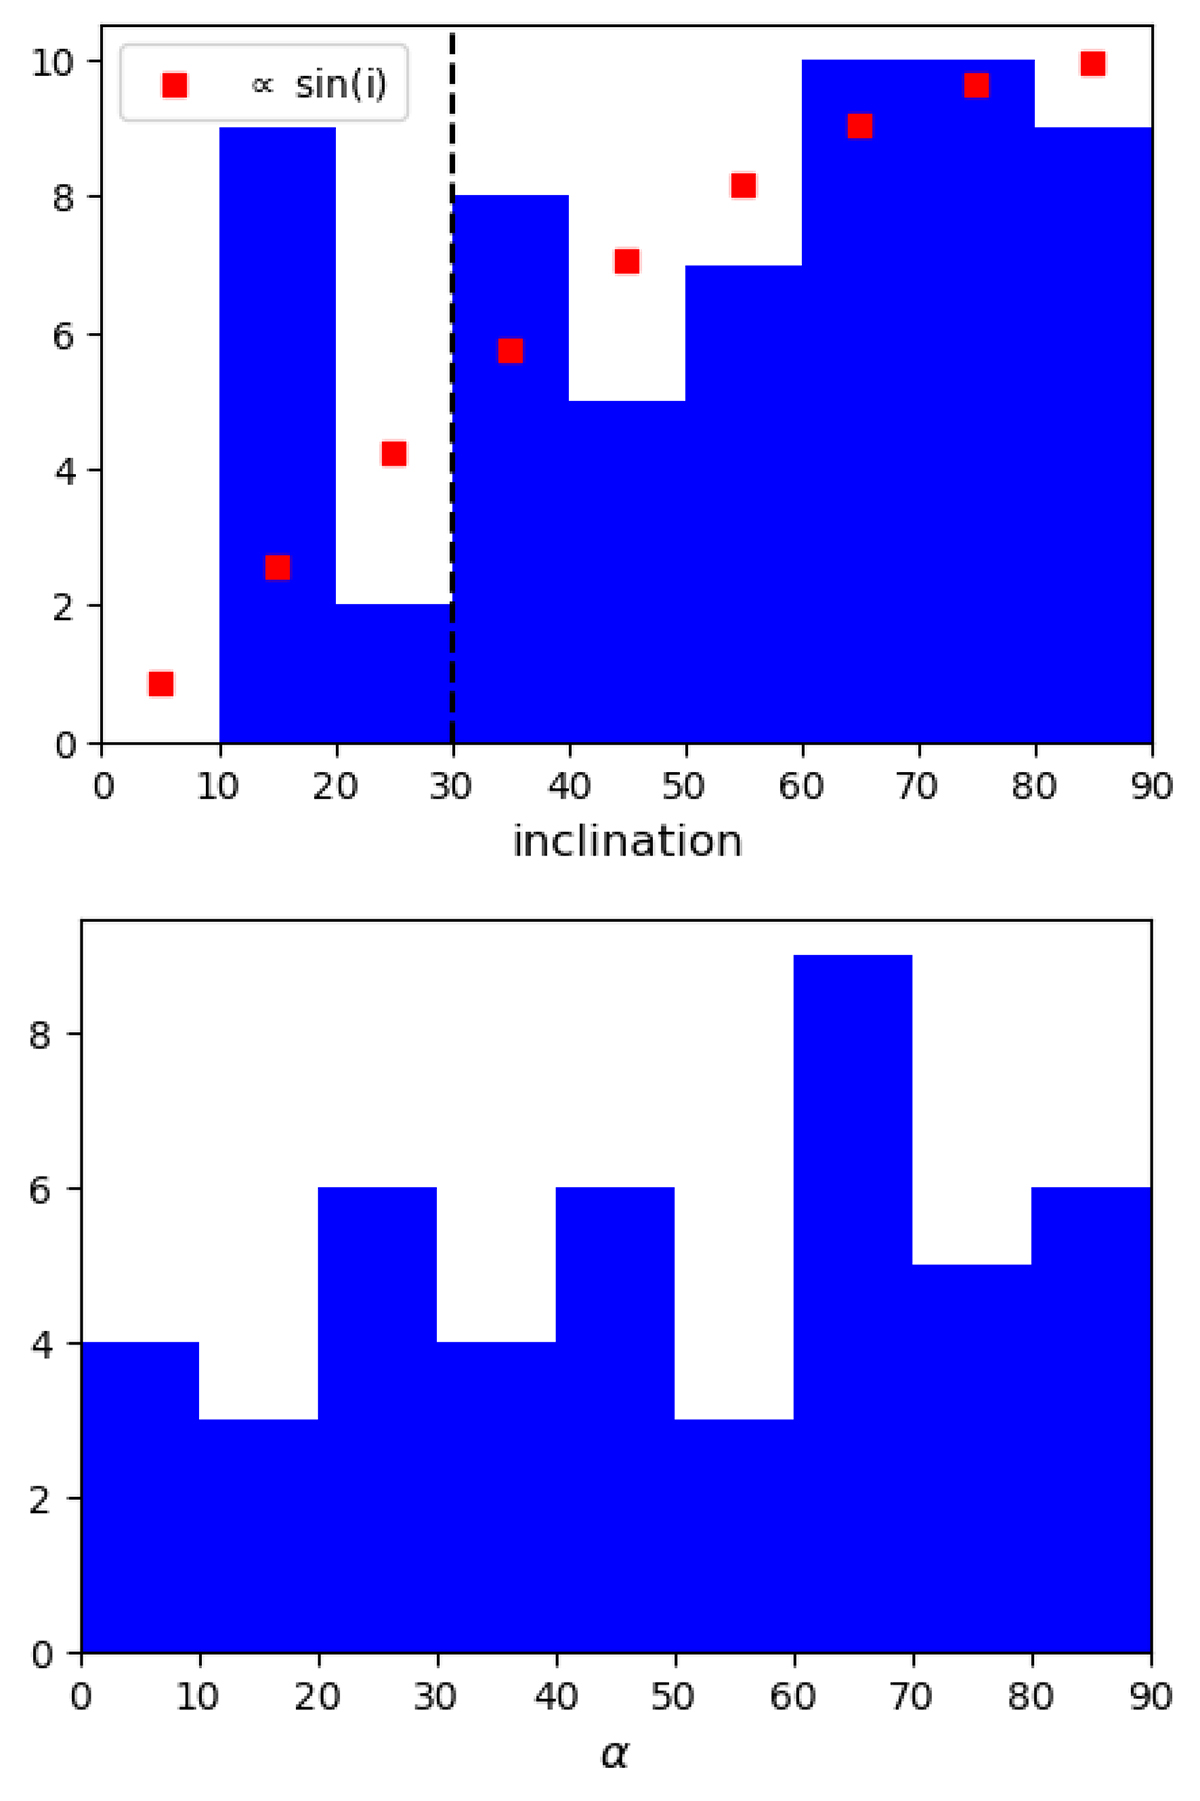
Top: Distribution of the GalPaK3D estimated inclination for the 60 galaxies modeled with GalPaK3D. Red dots are proportional to the expected sinus distribution. Bottom: Distribution of the azimuth angle α between galaxies major axis and LOS for the 46 isolated rotation dominated galaxies with sufficient inclination angle i > 30.
Current usage metrics show cumulative count of Article Views (full-text article views including HTML views, PDF and ePub downloads, according to the available data) and Abstracts Views on Vision4Press platform.
Data correspond to usage on the plateform after 2015. The current usage metrics is available 48-96 hours after online publication and is updated daily on week days.
Initial download of the metrics may take a while.