Fig. 7.
Download original image
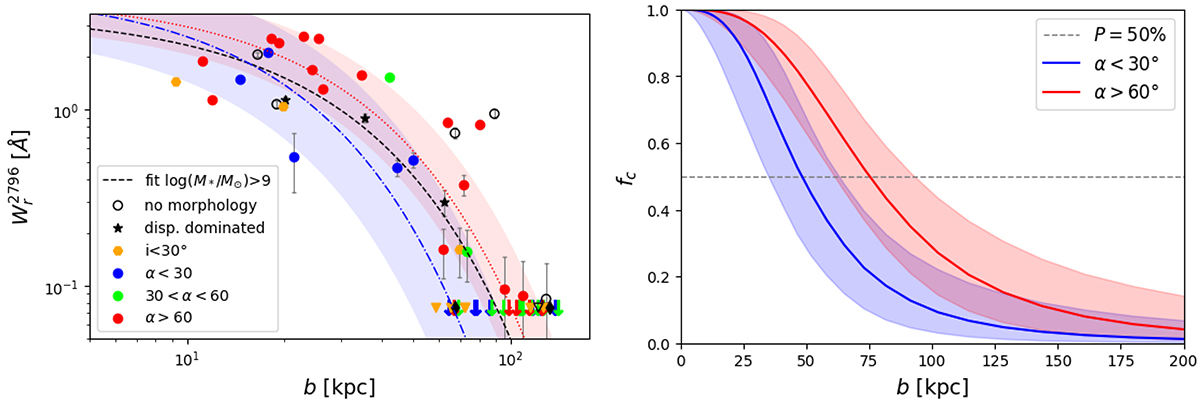
Dependence of the Mg II absorption profile on galaxy inclination and orientation. Left: ![]() -b relation for the 66 isolated galaxies from our sample. The best log linear fits are shown for the whole sample, as well as for the low-α and high-α subsamples. The mid-α subsample is not sufficiently populated at small b. The shaded areas are 1-σ intervals. Right: The 0.1 Å Mg II covering fraction for the low-α and high-α subsamples, represented by the blue and red lines, respectively. The shaded areas are 1-σ intervals.
-b relation for the 66 isolated galaxies from our sample. The best log linear fits are shown for the whole sample, as well as for the low-α and high-α subsamples. The mid-α subsample is not sufficiently populated at small b. The shaded areas are 1-σ intervals. Right: The 0.1 Å Mg II covering fraction for the low-α and high-α subsamples, represented by the blue and red lines, respectively. The shaded areas are 1-σ intervals.
Current usage metrics show cumulative count of Article Views (full-text article views including HTML views, PDF and ePub downloads, according to the available data) and Abstracts Views on Vision4Press platform.
Data correspond to usage on the plateform after 2015. The current usage metrics is available 48-96 hours after online publication and is updated daily on week days.
Initial download of the metrics may take a while.