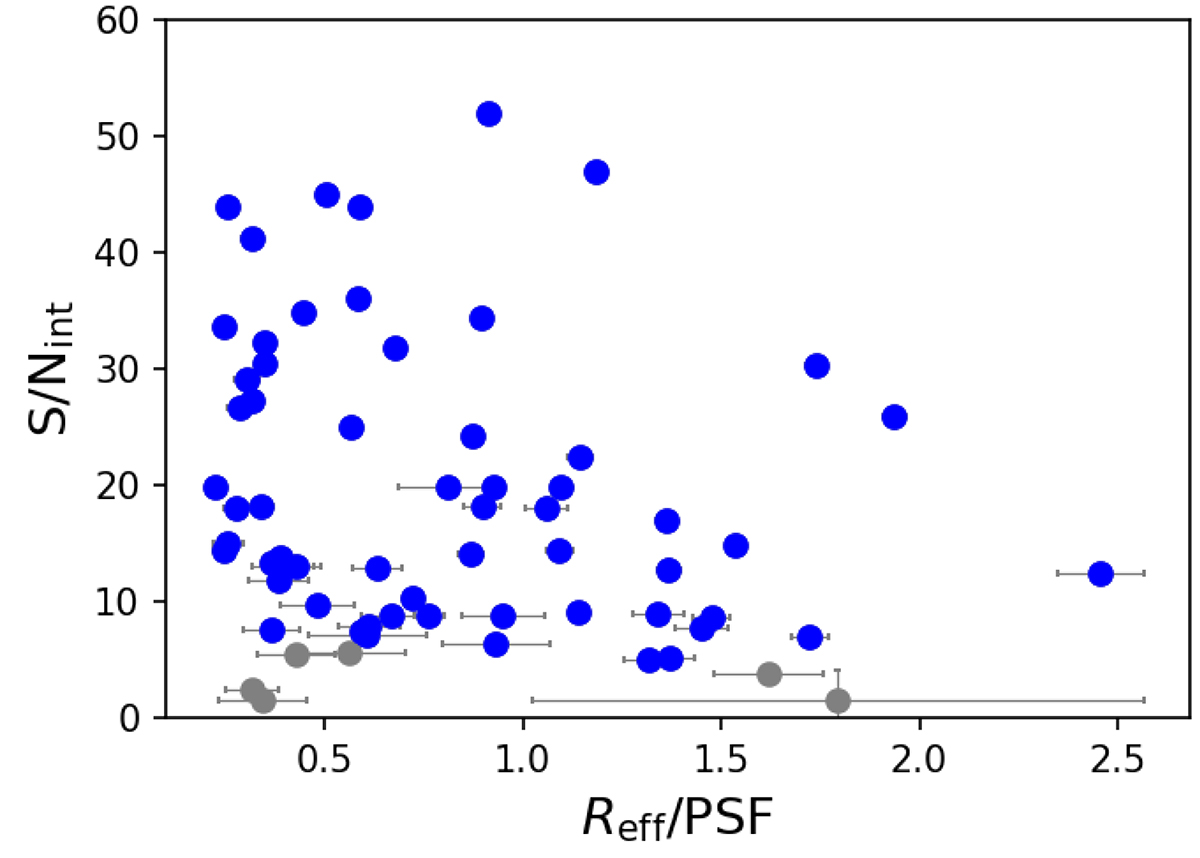
Fig. 2.
Download original image
Integrated S/N from pyplatefit versus effective radius divided by PSF full width at half maximum (FWHM) for the 66 isolated galaxies of our isolated galaxy sample. Galaxies for which GalPaK3D fits seem reliable are represented by blue dots. Galaxies with bad fits are represented by gray dots. Galaxies with bad GalPaK3D fits tend to have a low integrated S/N.
Current usage metrics show cumulative count of Article Views (full-text article views including HTML views, PDF and ePub downloads, according to the available data) and Abstracts Views on Vision4Press platform.
Data correspond to usage on the plateform after 2015. The current usage metrics is available 48-96 hours after online publication and is updated daily on week days.
Initial download of the metrics may take a while.