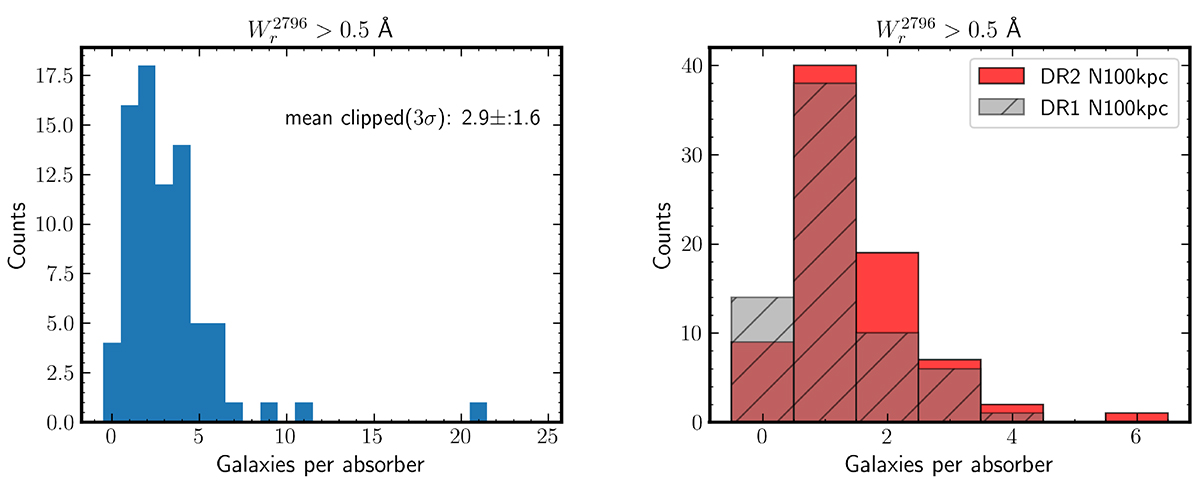
Fig. 9.
Download original image
Galaxies per absorption system. Left: Distribution of the number of galaxies that are within ±500 km s−1 of strong (![]() Å) absorption systems, within the MUSE FOV, and within the MUSE wavelength coverage for [O II] emitters, i.e. 0.35 < zabs < 1.45. The mean (median) number of galaxies is 2.9 ± 1.6 (3.0), respectively. Right: Red (hashed) histogram shows the number of galaxies around strong (
Å) absorption systems, within the MUSE FOV, and within the MUSE wavelength coverage for [O II] emitters, i.e. 0.35 < zabs < 1.45. The mean (median) number of galaxies is 2.9 ± 1.6 (3.0), respectively. Right: Red (hashed) histogram shows the number of galaxies around strong (![]() Å) Mg II absorption systems within 100 kpc in the redshift range 0.35 < z < 1.45 suitable for [O II] emitters, from the DR2 (DR1) samples, respectively.
Å) Mg II absorption systems within 100 kpc in the redshift range 0.35 < z < 1.45 suitable for [O II] emitters, from the DR2 (DR1) samples, respectively.
Current usage metrics show cumulative count of Article Views (full-text article views including HTML views, PDF and ePub downloads, according to the available data) and Abstracts Views on Vision4Press platform.
Data correspond to usage on the plateform after 2015. The current usage metrics is available 48-96 hours after online publication and is updated daily on week days.
Initial download of the metrics may take a while.