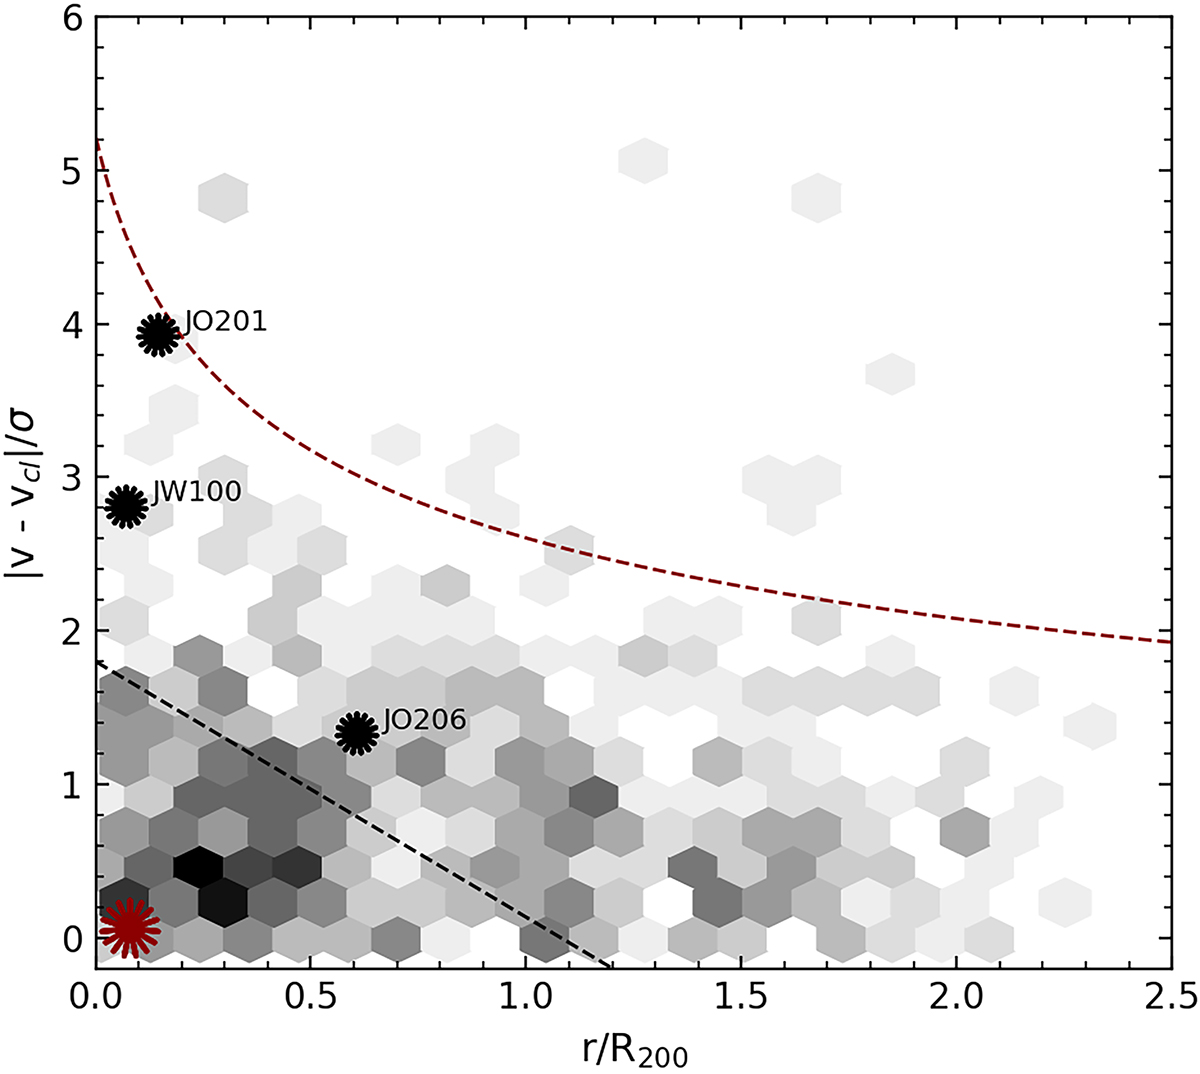
Fig. 9.
Download original image
Composite projected phase-space diagram of spectroscopically confirmed galaxy members of clusters Abell 85, IIZW108, Abell 2626 and ACO 3627 within which the comparison jellyfish galaxies (JO201, JO206, JW100) and ESO 137-001 are located, respectively. The red curve is the escape velocity in an NFW halo (Navarro et al. 1996). The dashed black line indicates the region where galaxies are most likely virialised. Black asterisks are the comparison sample of jellyfish galaxies within their respective galaxy clusters, and the red asterisk represents ESO 137-001.
Current usage metrics show cumulative count of Article Views (full-text article views including HTML views, PDF and ePub downloads, according to the available data) and Abstracts Views on Vision4Press platform.
Data correspond to usage on the plateform after 2015. The current usage metrics is available 48-96 hours after online publication and is updated daily on week days.
Initial download of the metrics may take a while.