Fig. 4.
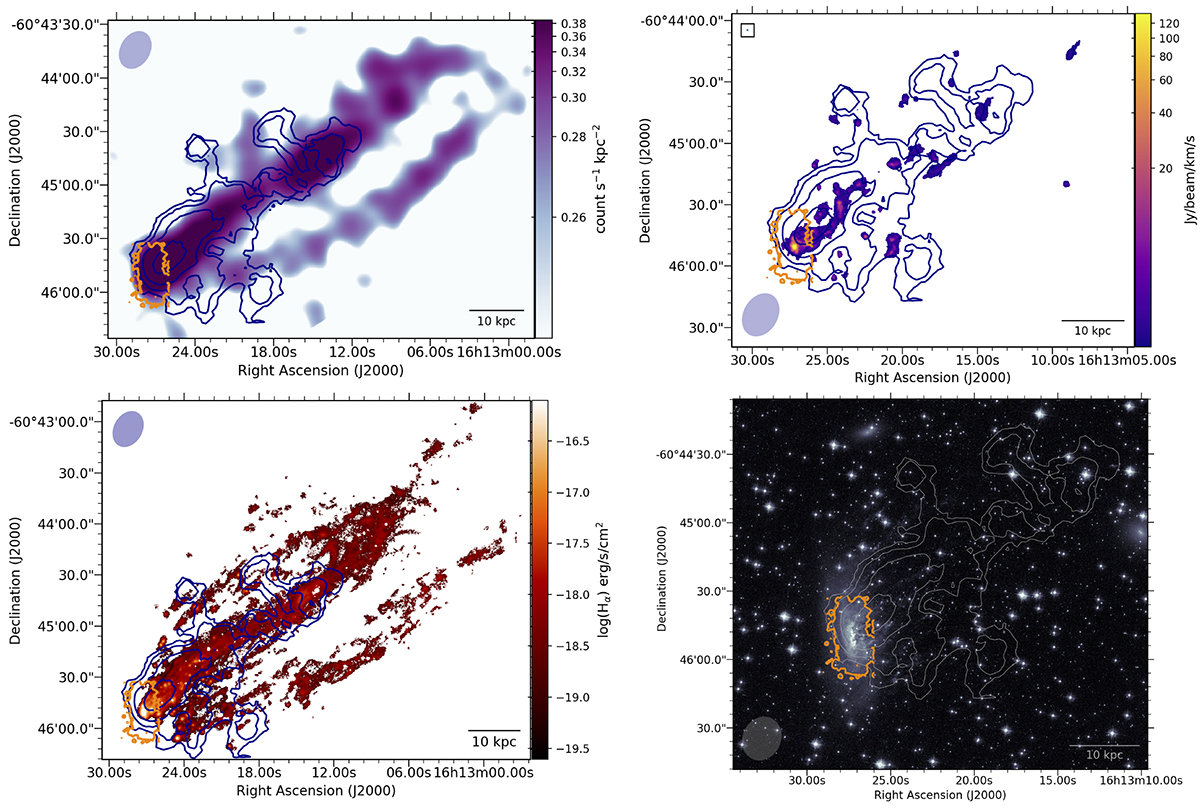
Download original image
H I spatial distribution compared to X-ray, CO, Hα and optical maps. The H I contours are at drawn at column densities of NHI = 2.3, 4.6, 9.2, 18.4 × 10¹⁹ atoms/cm2. The orange contour is the galaxy disc, as in Fig. 1. Top left panel: H I over Chandra 0.6–2.0 keV count X-ray image. Top right panel: H I overlaid on the CO (2–1) flux intensity map from ALMA. Bottom left and right panels: H I contours over the Hα emission from MUSE and the HST WFC3 image (see also Fig. 1 in Waldron et al. 2023), respectively.
Current usage metrics show cumulative count of Article Views (full-text article views including HTML views, PDF and ePub downloads, according to the available data) and Abstracts Views on Vision4Press platform.
Data correspond to usage on the plateform after 2015. The current usage metrics is available 48-96 hours after online publication and is updated daily on week days.
Initial download of the metrics may take a while.