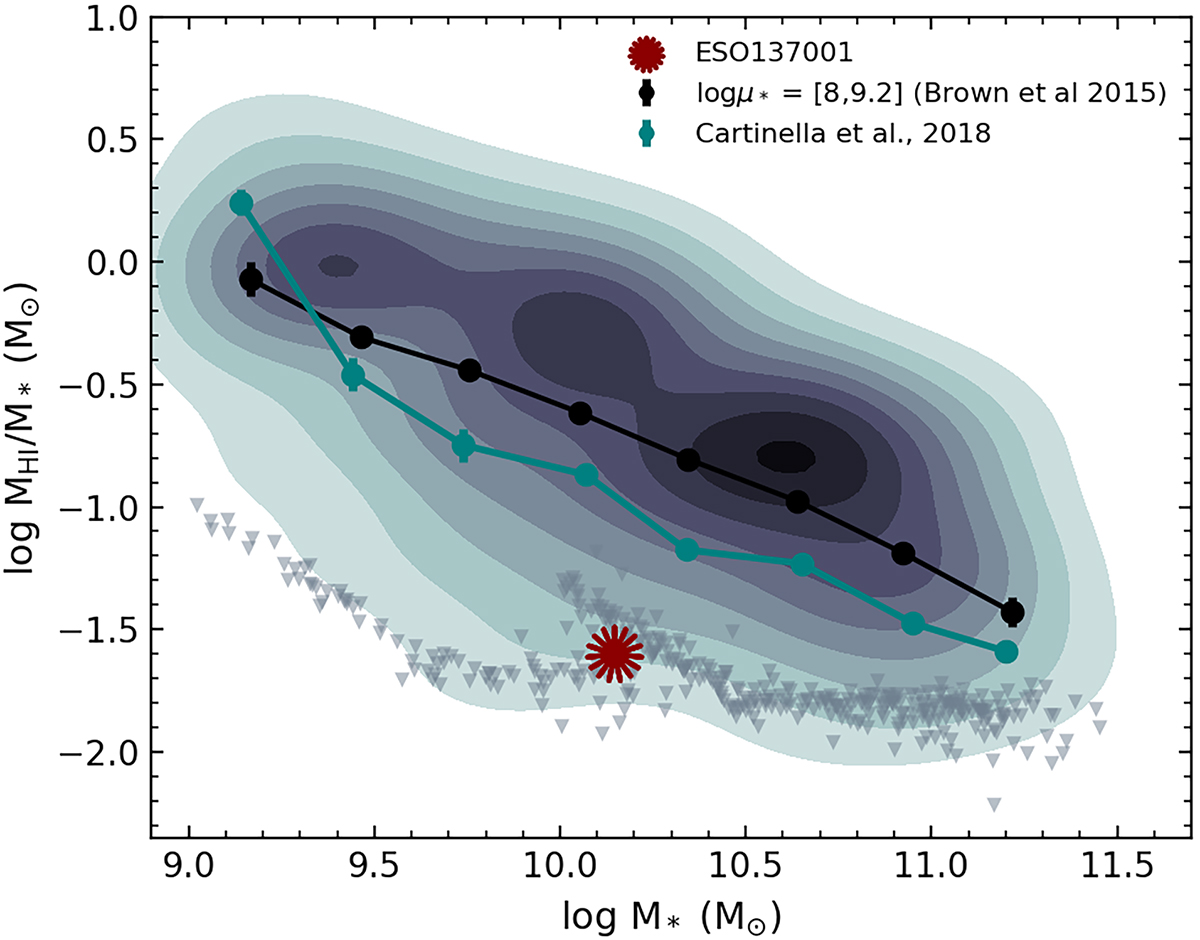
Fig. 2.
Download original image
H I fraction as a function of the stellar mass. Field galaxies from xGASS are shown in grey where the contours are H I detected galaxies, and the triangles represent the non-detections. The xGASS scaling relations based on average gas fraction per stellar mass bin are shown in cyan, while the black points represent galaxies with stellar surface brightness comparable to that of ESO 137-001. The scatter in the mass bins is illustrated by the error bars. ESO 137-001 is represented by the red asterisk.
Current usage metrics show cumulative count of Article Views (full-text article views including HTML views, PDF and ePub downloads, according to the available data) and Abstracts Views on Vision4Press platform.
Data correspond to usage on the plateform after 2015. The current usage metrics is available 48-96 hours after online publication and is updated daily on week days.
Initial download of the metrics may take a while.