Open Access
Fig. 9.
Download original image
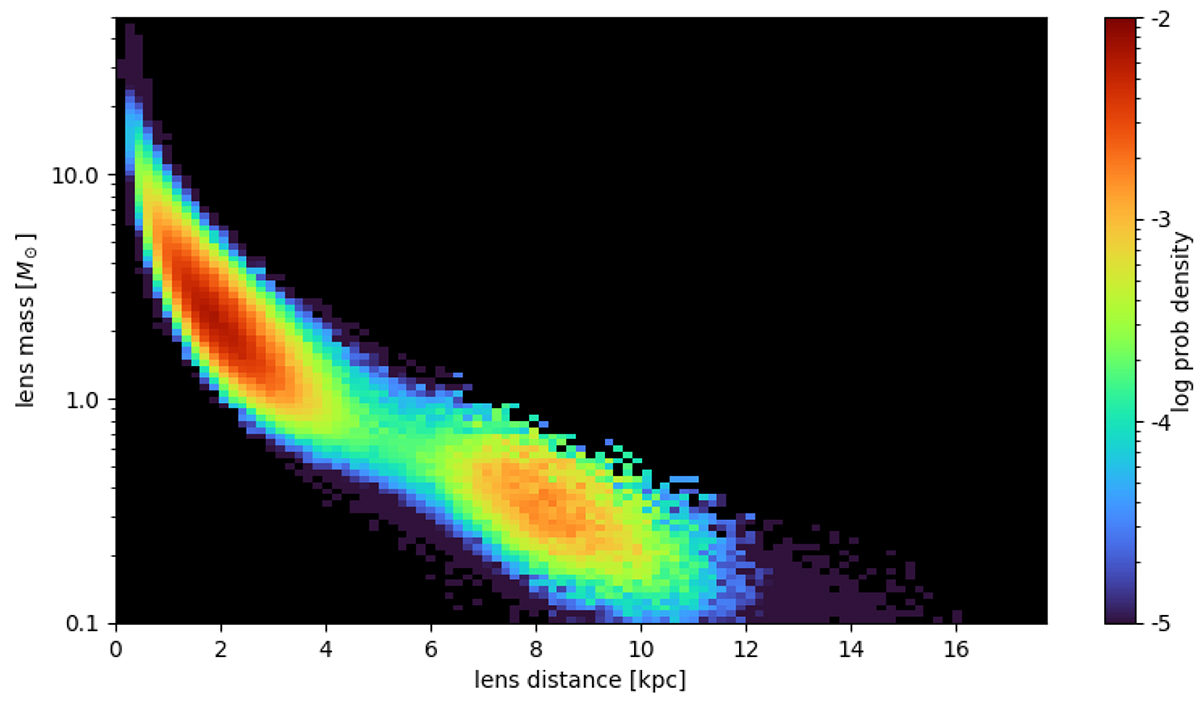
DarkLensCode output for the GO+ microlensing model assuming the DarkIMF. This diagram shows the posterior distribution of the distance to the lens and its mass. The colours correspond to the log probability density. The dark color of a bin means that there were no samples present in this bin.
Current usage metrics show cumulative count of Article Views (full-text article views including HTML views, PDF and ePub downloads, according to the available data) and Abstracts Views on Vision4Press platform.
Data correspond to usage on the plateform after 2015. The current usage metrics is available 48-96 hours after online publication and is updated daily on week days.
Initial download of the metrics may take a while.