Open Access
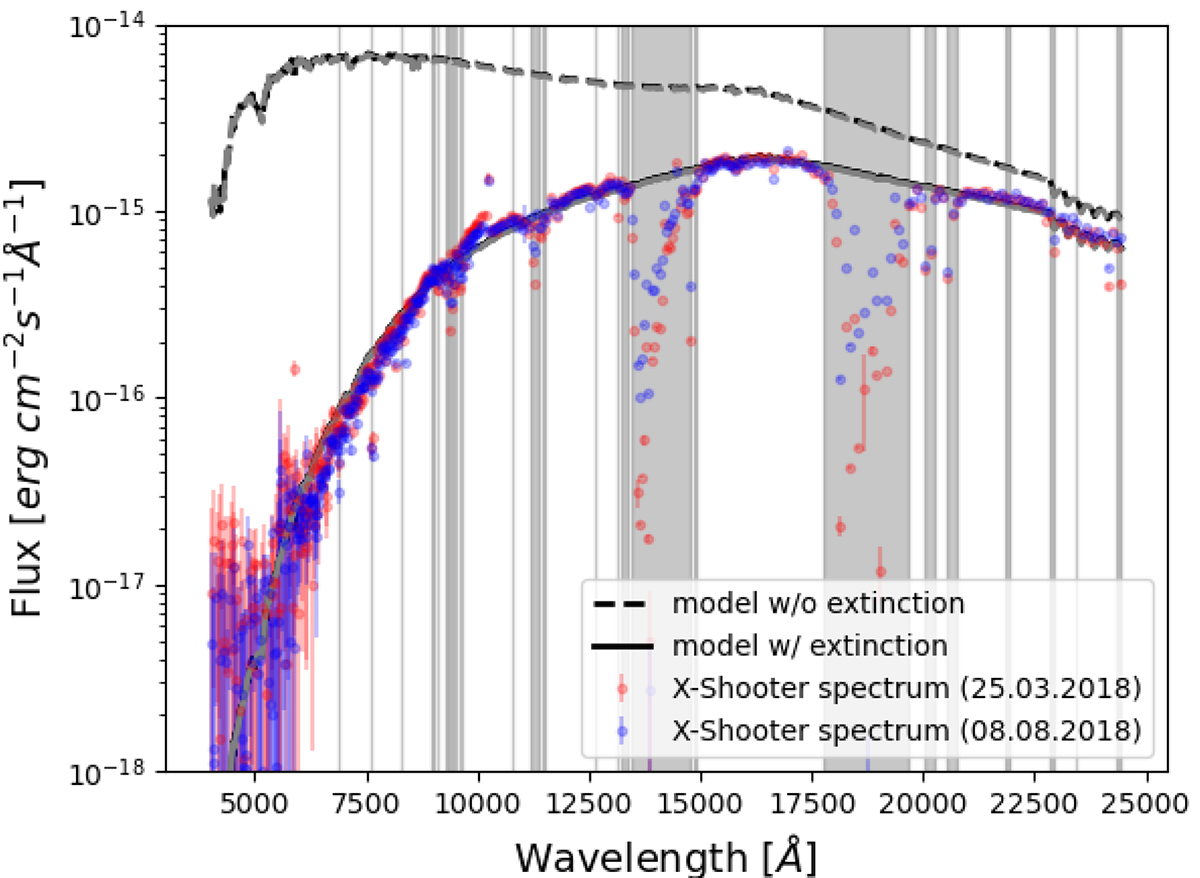
Fig. 7.
Download original image
Two spectra from VLT/X-shooter obtained in March 25 (red) and August 8 (blue), 2018, as well as the best models with (solid lines) and without (dashed lines) extinction correction. The grey vertical lines and regions indicate the telluric bands, where the data were not used for the modelling.
Current usage metrics show cumulative count of Article Views (full-text article views including HTML views, PDF and ePub downloads, according to the available data) and Abstracts Views on Vision4Press platform.
Data correspond to usage on the plateform after 2015. The current usage metrics is available 48-96 hours after online publication and is updated daily on week days.
Initial download of the metrics may take a while.