Open Access
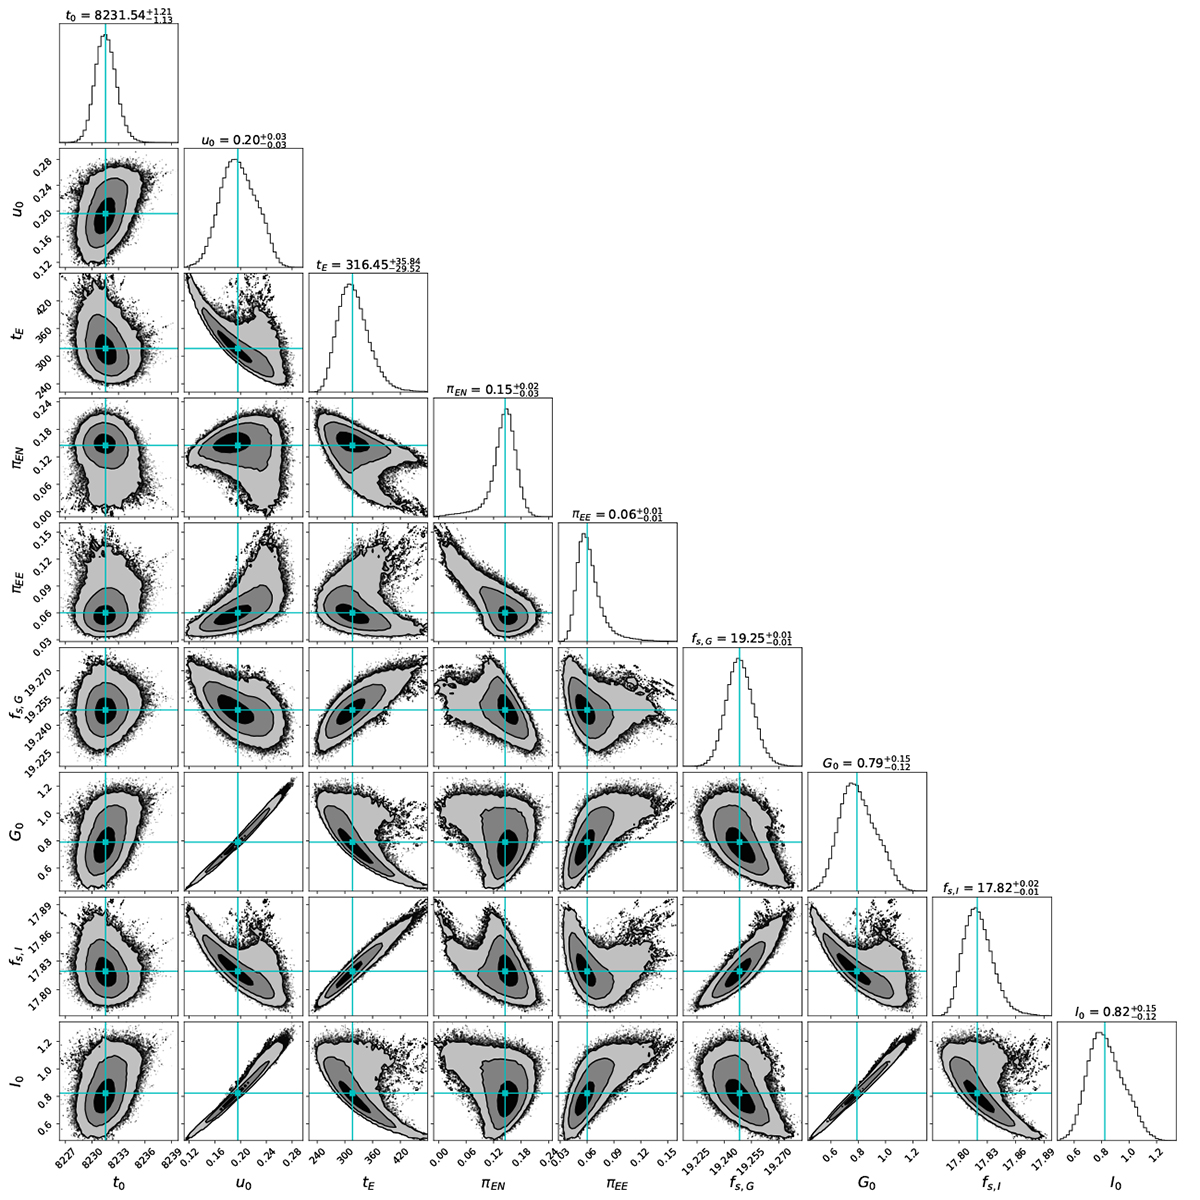
Fig. B.1.
Download original image
Corner plot of the microlensing parameters from the MCMC fit of the GO+ solution. The plot exhibits 1σ, 2σ, and 3σ confidence regions with solid black, dark grey, and light grey colors, respectively. Any solutions outside of the 3σ confidence level are represented by black dots.
Current usage metrics show cumulative count of Article Views (full-text article views including HTML views, PDF and ePub downloads, according to the available data) and Abstracts Views on Vision4Press platform.
Data correspond to usage on the plateform after 2015. The current usage metrics is available 48-96 hours after online publication and is updated daily on week days.
Initial download of the metrics may take a while.