Fig. 10.
Download original image
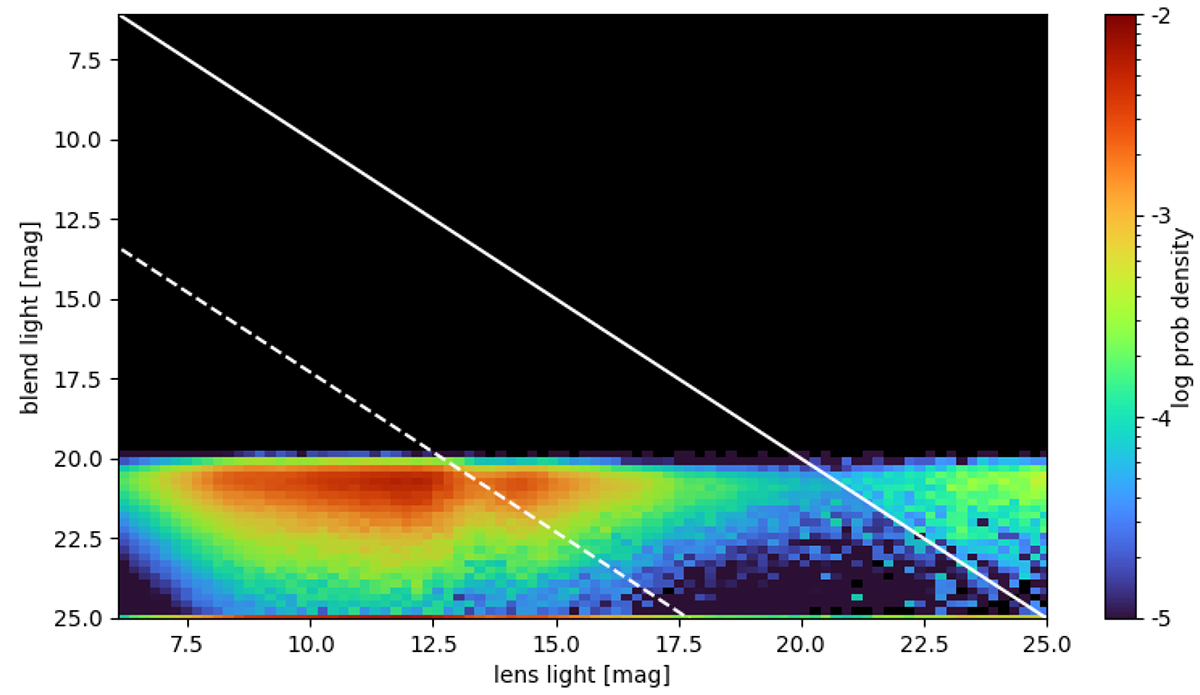
DarkLensCode output for the GO+ microlensing model assuming the StellarIMF mass function. Posterior distribution of the blended light magnitude and lens light magnitude assuming that the lens is an MS star. The solid line represents the upper limit of extinction, while the dashed line represents the lower limit of extinction. Lines separate the dark lens solutions from the MS star solutions. The colours correspond to the log probability density. Black bins are those containing no samples.
Current usage metrics show cumulative count of Article Views (full-text article views including HTML views, PDF and ePub downloads, according to the available data) and Abstracts Views on Vision4Press platform.
Data correspond to usage on the plateform after 2015. The current usage metrics is available 48-96 hours after online publication and is updated daily on week days.
Initial download of the metrics may take a while.