Fig. 9.
Download original image
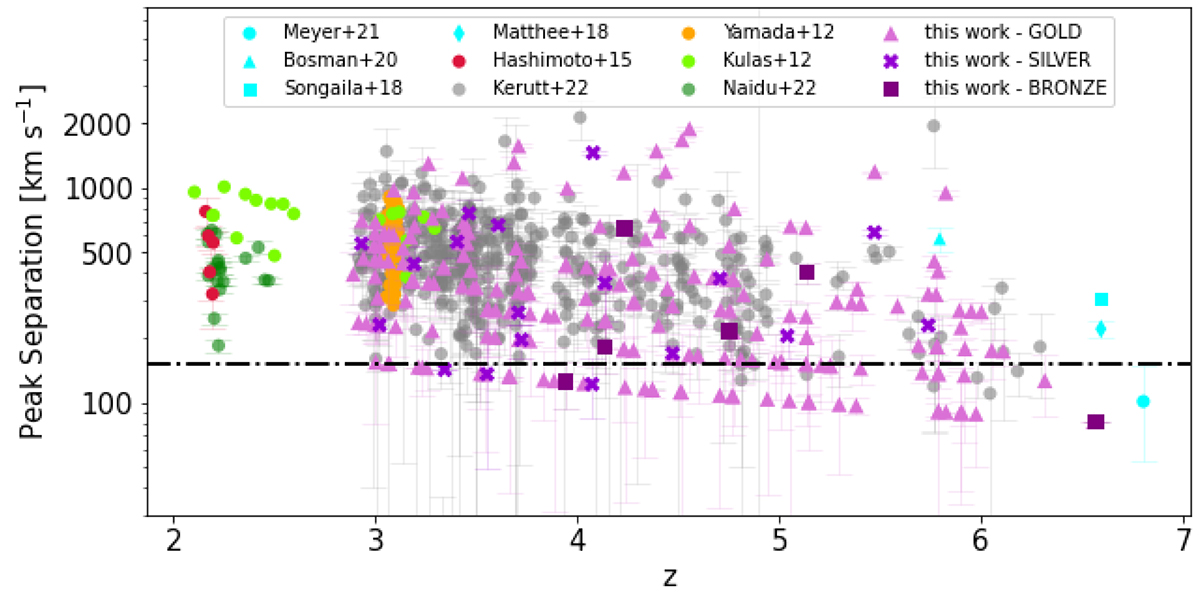
Peak separation plotted against the redshift for our double-peak sample and for several studies (Kulas et al. 2012; Yamada et al. 2012; Hashimoto et al. 2015; Matthee et al. 2018; Songaila et al. 2018; Bosman et al. 2020; Meyer et al. 2021; Naidu et al. 2022). Our double-peak sample represented in purple shows three different symbols for the three categories GOLD (triangle), SILVER (cross), and BRONZE (square). A horizontal black dash-dotted line at 150 km s−1 represents the peak separation threshold made in Sect. 4.1.2 to obtain the fraction of double-peaks. The peak separations are in discrete lines due to the fact that the minimal peak separation measured is two spectral bins and depends on redshift.
Current usage metrics show cumulative count of Article Views (full-text article views including HTML views, PDF and ePub downloads, according to the available data) and Abstracts Views on Vision4Press platform.
Data correspond to usage on the plateform after 2015. The current usage metrics is available 48-96 hours after online publication and is updated daily on week days.
Initial download of the metrics may take a while.