Fig. 8.
Download original image
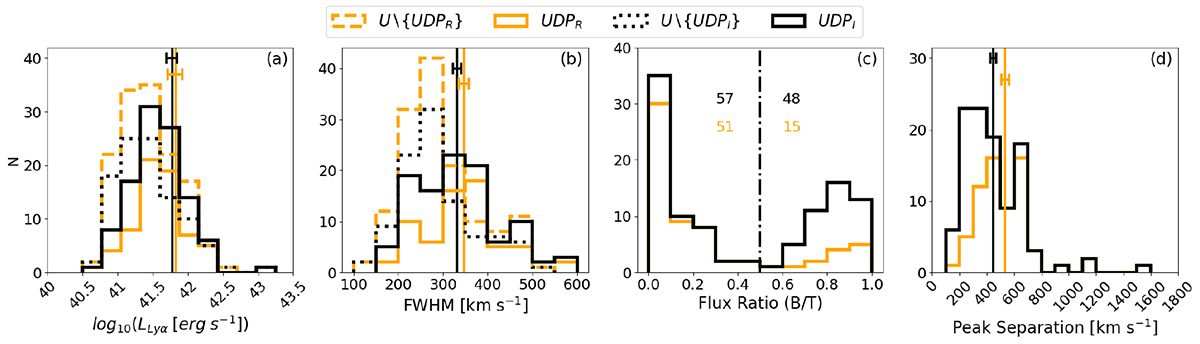
Physical parameter distributions of the unbiased samples. (a): Logarithmic Lyα luminosity distribution. (b): FWHM distribution of the peak of the Lyα line with the strongest flux. (c): B/T distribution measured on the Lyα emission lines of the double-peaked objects. B/T = 0.5 is represented by a black dash-dotted line. The numbers written in black and orange correspond to the number of galaxies having a B/T value below 0.5 (N = 57 for UDPI and N = 51 for UDPR) and above 0.5 (N = 48 for UDPI and N = 15 for UDPR). (d): Peak separation distribution of the double-peak samples. In orange are represented the restrictive samples: U ∖ {UDPR} in dashed lines and UDPR in solid line. In black are represented the inclusive samples: U ∖ {UDPI} in dotted lines and UDPI in solid line.
Current usage metrics show cumulative count of Article Views (full-text article views including HTML views, PDF and ePub downloads, according to the available data) and Abstracts Views on Vision4Press platform.
Data correspond to usage on the plateform after 2015. The current usage metrics is available 48-96 hours after online publication and is updated daily on week days.
Initial download of the metrics may take a while.