Fig. 7.
Download original image
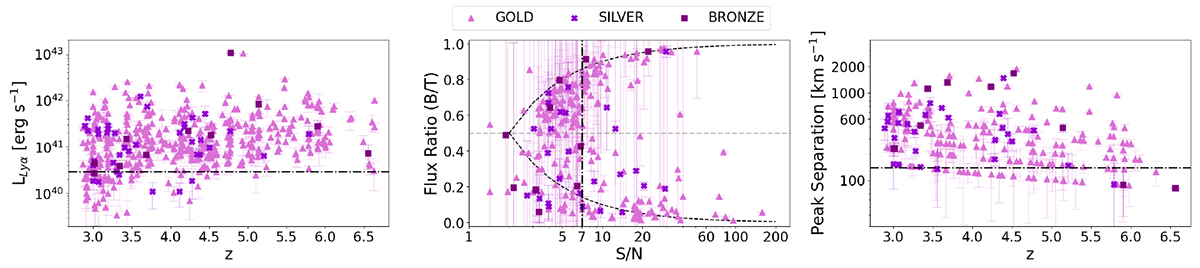
Figures illustrating the observational limitations of our sample. GOLD, SILVER, and BRONZE objects are represented by triangles, crosses, and squares symbols, respectively. Left: Lyα luminosity as a function of redshift for the parent sample. The horizontal black dash-dotted line represents the luminosity cut (LLyα = 3 × 1040 [erg s−1]) used to mitigate the redshift dependence. Middle: B/T flux ratio as a function of S/N (calculated as described in Sect. 3.5) for the whole double-peak sample. B/T ≈ 0 objects can be seen in Appendix D. They have a very small blue peak. The horizontal grey dashed line at B/T = 0.5 marks the blue-dominated versus red-dominated dividing line. The vertical black dash-dotted line represents the S/N cut (S/N = 7) made to balance the demands of being able to detect extreme B/T and keeping a representative subsample of double-peaks. The dashed lines mark boundaries of 1/(S/N) < B/T < 1–1/(S/N). Three objects have a B/T > 1 because the total flux is smaller than the flux in the blue peak because the continuum is negative between the peaks (see Appendix D). Right: Peak separation as a function of redshift for the whole double-peak sample. The horizontal black dash-dotted line represents the vsep cut (vsep = 150 km s−1) used to account for the spectral resolution of MUSE. For both the Lyα luminosity and the vsep, the observational sensitivity and spectral resolution curves are not straight lines. The ones shown in the plots are our selection limits.
Current usage metrics show cumulative count of Article Views (full-text article views including HTML views, PDF and ePub downloads, according to the available data) and Abstracts Views on Vision4Press platform.
Data correspond to usage on the plateform after 2015. The current usage metrics is available 48-96 hours after online publication and is updated daily on week days.
Initial download of the metrics may take a while.