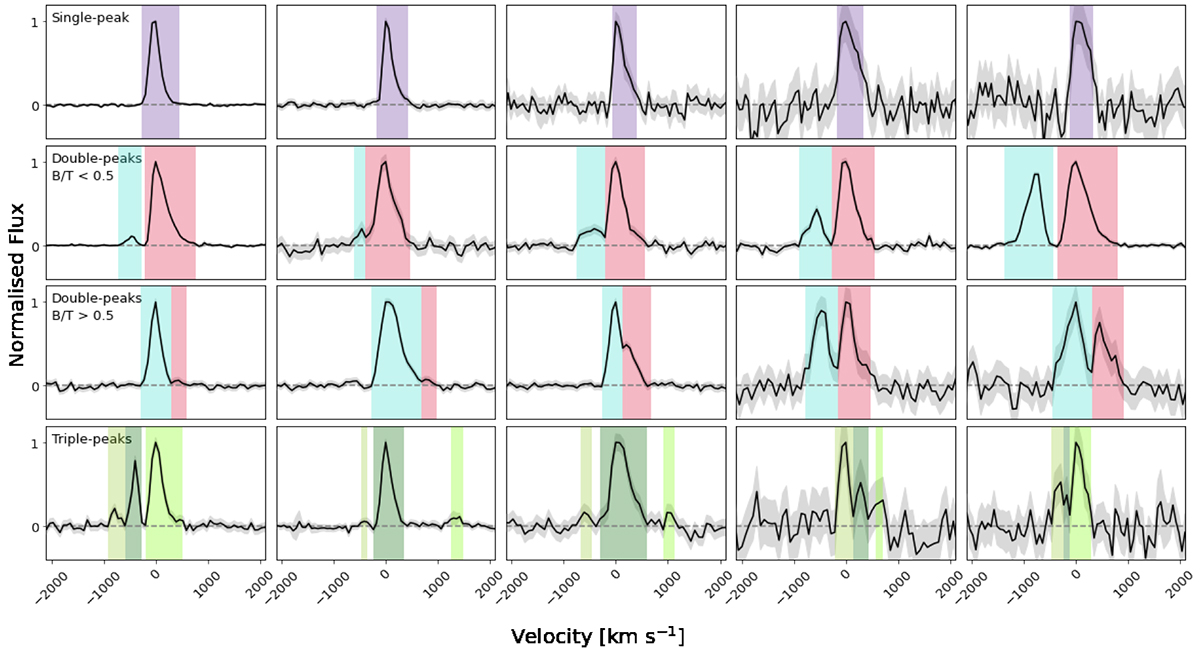
Fig. 5.
Download original image
Examples of the different spectral shape categories (Sect. 4.1), except the ‘no-peak’ category (see Appendix D). First row: spectra of single-peak galaxies. Second and third rows: spectra from sources belonging to the double-peak category, red and blue dominated spectra, respectively. Last row: spectra showing triple-peak Lyα lines. We note that the y-axis shows the flux normalized to the maximum of each line.
Current usage metrics show cumulative count of Article Views (full-text article views including HTML views, PDF and ePub downloads, according to the available data) and Abstracts Views on Vision4Press platform.
Data correspond to usage on the plateform after 2015. The current usage metrics is available 48-96 hours after online publication and is updated daily on week days.
Initial download of the metrics may take a while.