Fig. 4.
Download original image
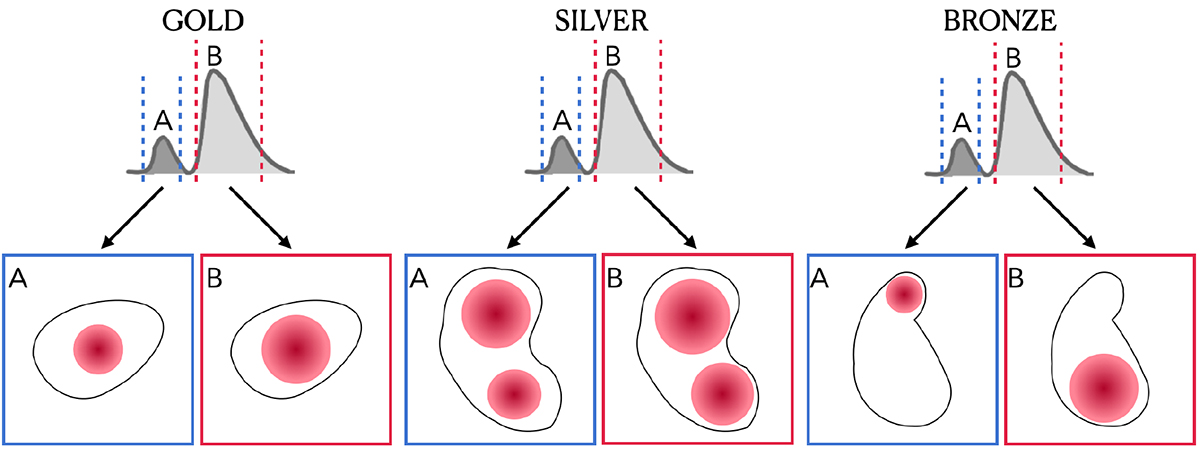
Illustrations of GOLD, SILVER and BRONZE double-peaked galaxies. Left panel: Illustration of a GOLD double-peaked galaxy. The emission of each peak (red circle) is located inside the segmentation map (black contour) at the same spatial location. Middle panel: SILVER category. Each peak of the double-peaked Lyα line is coming from two different locations inside the segmentation map. Right panel: Case of a BRONZE galaxy. The blue peak (A) is emitted in a certain region and the red peak (B) is emitted in a different region of the segmentation map.
Current usage metrics show cumulative count of Article Views (full-text article views including HTML views, PDF and ePub downloads, according to the available data) and Abstracts Views on Vision4Press platform.
Data correspond to usage on the plateform after 2015. The current usage metrics is available 48-96 hours after online publication and is updated daily on week days.
Initial download of the metrics may take a while.