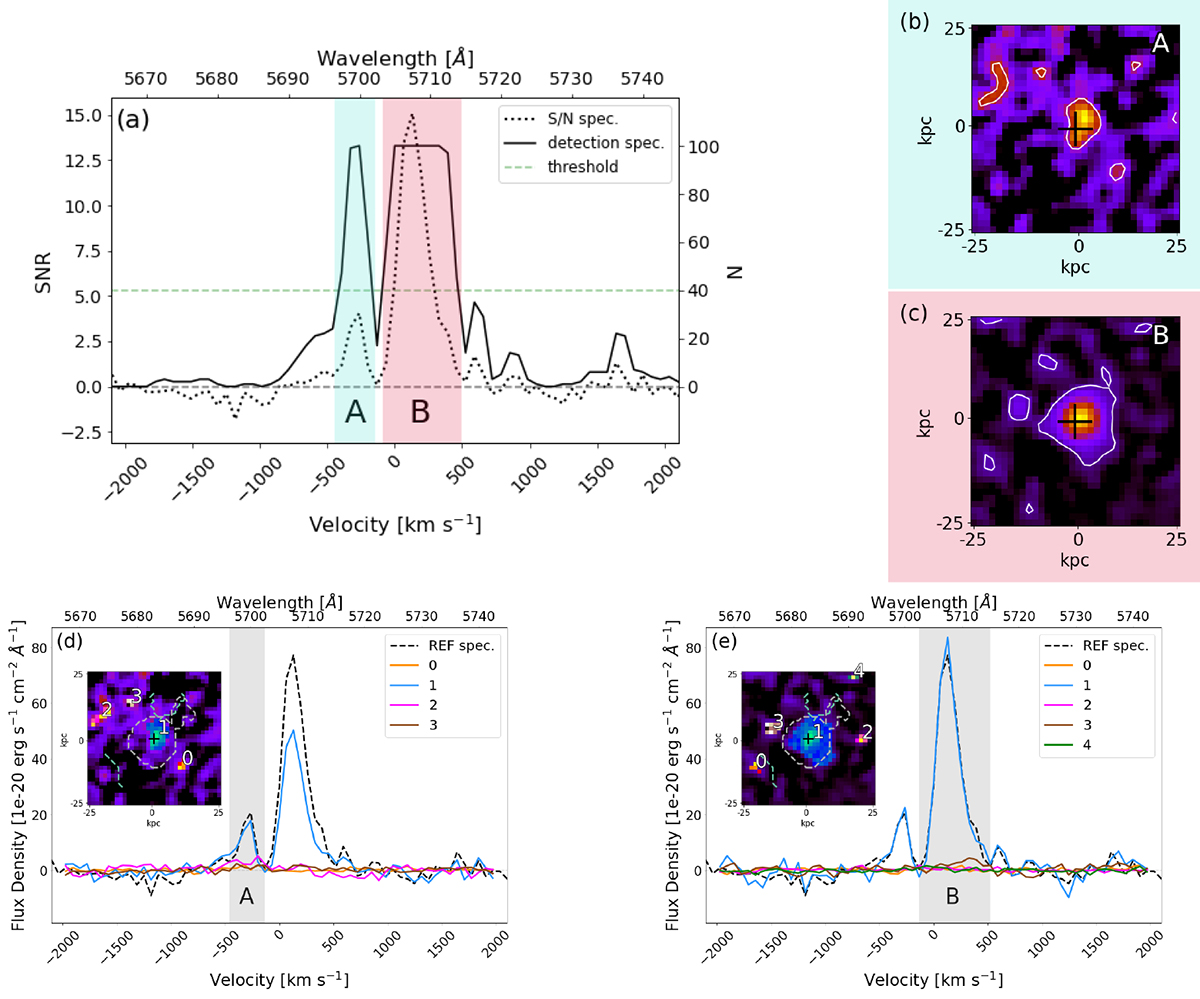
Fig. 3.
Download original image
ID 3240, double-peak, GOLD category. (a): Example of a detection spectrum in black obtained from the 100 realizations of the original spectrum (Sect. 3.2). The S/N spectrum of the original spectrum is plotted in dotted black. The horizontal dashed green line shows our detection threshold of N = 40 defining areas of signal. The blue A and red B shaded areas correspond to the areas of signal obtained by the crossing of the detection spectrum with the threshold line of N = 40. (b) and (c): 50 × 50 kpc2 NB images of the area of signal A and the area of signal B, respectively. The black cross represents the centre coordinates of the source. The white contours correspond to a S/N level of 2. (d) and (e): Spectra extracted from the photutils.SourceFinder segmentation maps (Sect. 3.3). The colour of each spectrum matches the NB image segmentation map colour inserted in the plot. Only the blue spectrum extracted from the blue SourceFinder segmentation map number ‘1’ contributes to the Lyα line. The reference spectrum (Sect. 2.3) in black dashed line is displayed as a reference. The dashed contours on the NB images represent the reference segmentation maps used in B23. The grey dashed contour is the segmentation map of the targeted source, the green ones correspond to other objects.
Current usage metrics show cumulative count of Article Views (full-text article views including HTML views, PDF and ePub downloads, according to the available data) and Abstracts Views on Vision4Press platform.
Data correspond to usage on the plateform after 2015. The current usage metrics is available 48-96 hours after online publication and is updated daily on week days.
Initial download of the metrics may take a while.