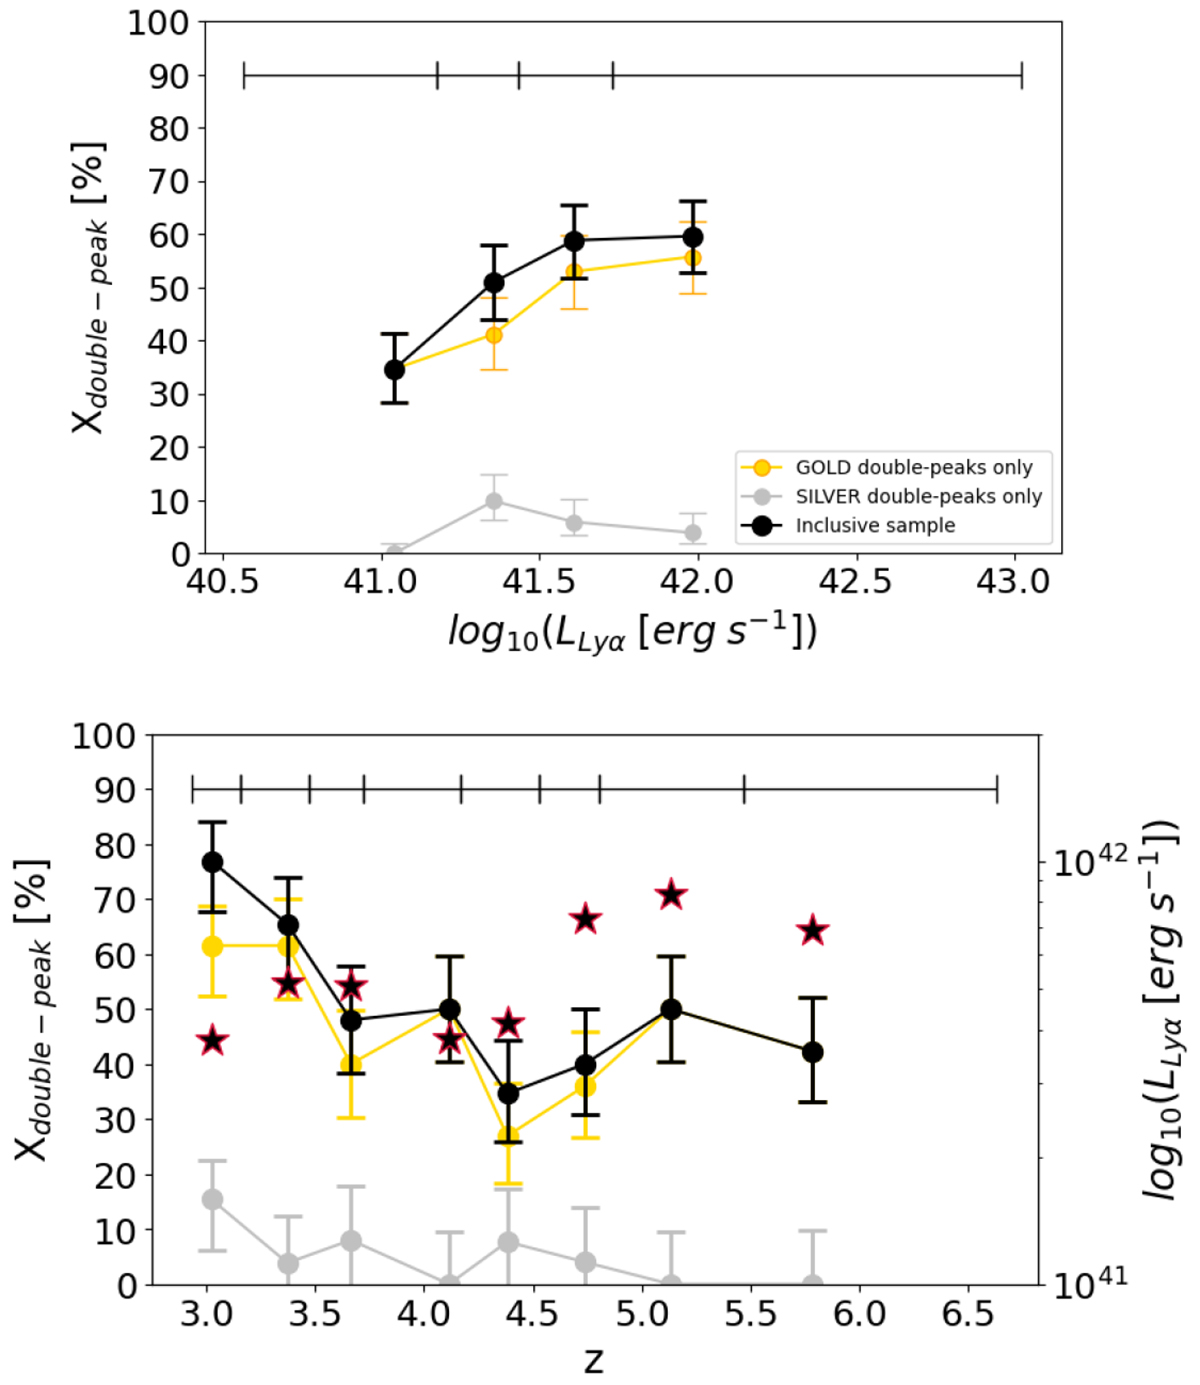
Fig. E.1.
Download original image
Fraction of double-peaked LAEs plotted against the logarithmic Lyα luminosity and the redshift. Left panel: Fraction of double-peaked LAEs plotted against the logarithmic Lyα luminosity. The unbiased sample U has been divided into four luminosity bins with the same number of objects (51 or 52). The fraction of double-peaks has been derived in each bin. The results are positioned at the median Lyα luminosity of each bin. The horizontal black line at the top of the figure shows the size of each Lyα luminosity bin. Right panel: Fraction of double-peaked LAEs plotted against the redshift. The unbiased sample U has been divided into eight redshift bins with the same number of objects (25 or 26). The fraction of double-peaks has been derived in each bin. The results are positioned at the median redshift of each bin. The black stars surrounded in red represent the mean Lyα luminosity of each bin. The black dots represents the total fraction of double-peaks (NUDPI/NU). The UDPI is composed of GOLD and SILVER double-peaks. The yellow dots show the fraction of GOLD double-peaks (NUDPI GOLD/NU) among U. The fraction of SILVER double-peaks (NUDPI SILVER/NU) is represented by the grey dots.
Current usage metrics show cumulative count of Article Views (full-text article views including HTML views, PDF and ePub downloads, according to the available data) and Abstracts Views on Vision4Press platform.
Data correspond to usage on the plateform after 2015. The current usage metrics is available 48-96 hours after online publication and is updated daily on week days.
Initial download of the metrics may take a while.