Fig. 2.
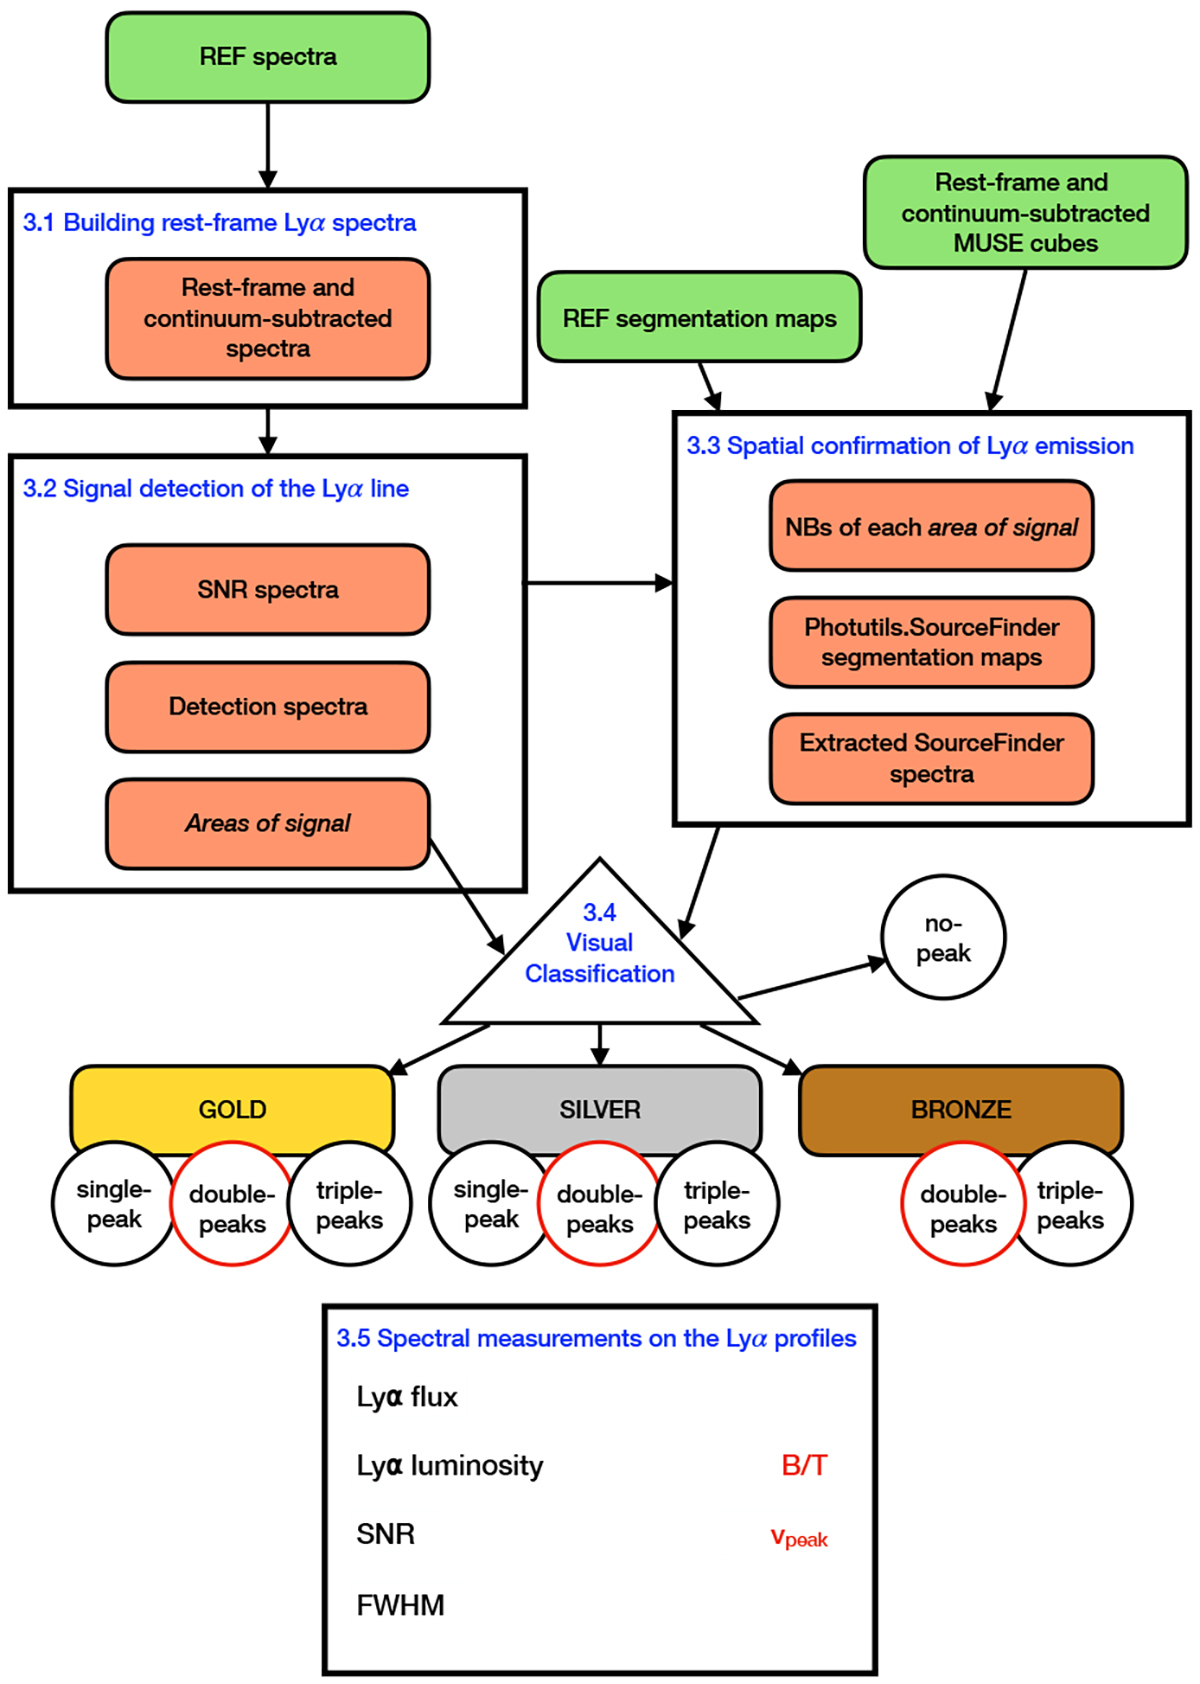
Download original image
Flowchart of the method. The input data are indicated by green boxes at the top of the figure. Black boxes refer to the different steps of the method. The corresponding sections of the paper are shown in blue. The orange boxes inside the black ones indicate the output data. The visual classification is shown by a triangle (see Sect. 3.4). The GOLD, SILVER, and BRONZE categories are illustrated by a gold, a grey, and a brown rectangle, respectively. The spectral shapes of the Lyα emission are indicated by circles, black for single- and triple-peaks and red for double-peaks. The box at the bottom presents the Lyα spectral parameters (black) and the spectral parameters measured for double-peak objects (red), detailed in Sect. 3.5.
Current usage metrics show cumulative count of Article Views (full-text article views including HTML views, PDF and ePub downloads, according to the available data) and Abstracts Views on Vision4Press platform.
Data correspond to usage on the plateform after 2015. The current usage metrics is available 48-96 hours after online publication and is updated daily on week days.
Initial download of the metrics may take a while.