Fig. 17.
Download original image
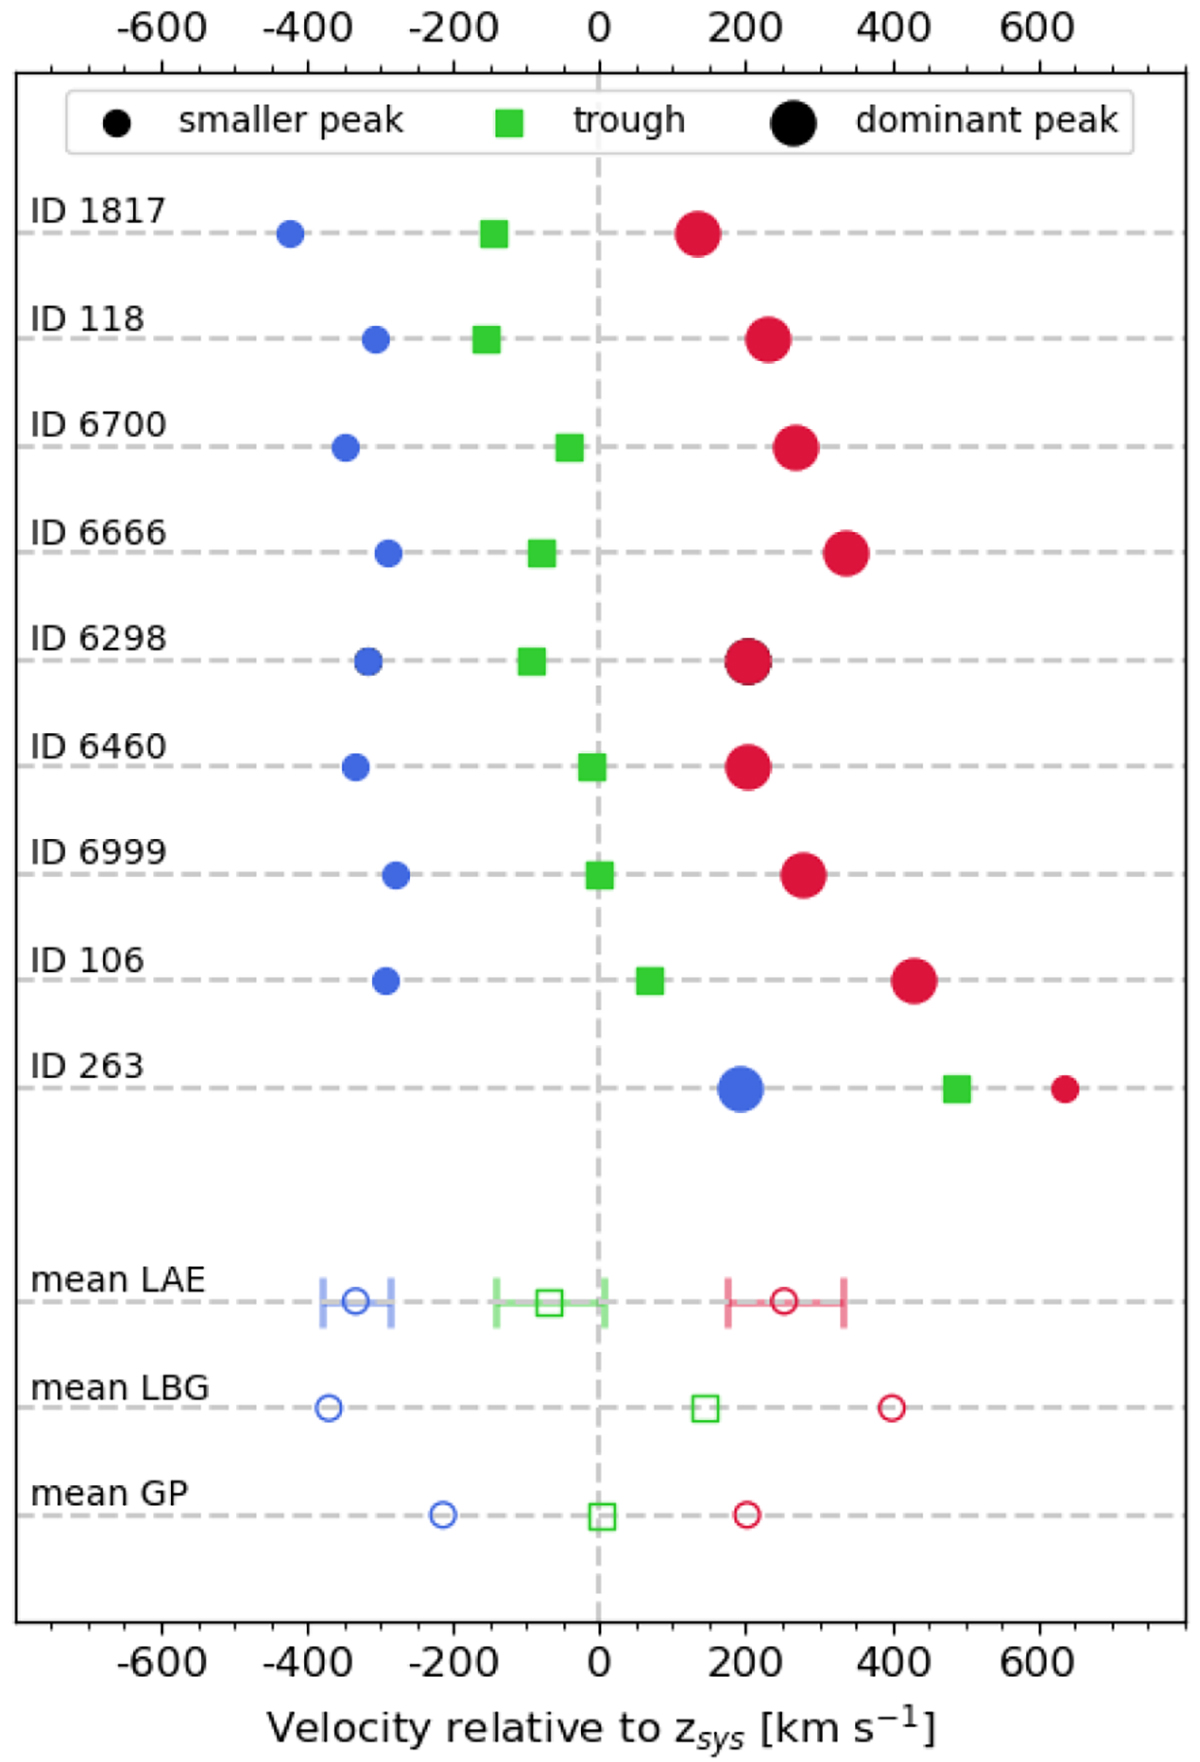
Velocities of every peak and trough for the double-peaked galaxies having a systemic redshift (Sect. 5.3). Each line corresponds to a source, where the blue (red) circle shows the bluer (redder) peak and the green square indicates the position of the trough. The larger circle represents the peak with the highest flux. The first line of the bottom part of the figure shows the mean positions of the trough and the blue and red peaks of the objects shown above (without taking into account ID 263). The mean LBG and mean Green Pea (GP) are drawn from the literature, Kulas et al. (2012) and Orlitová et al. (2018), respectively.
Current usage metrics show cumulative count of Article Views (full-text article views including HTML views, PDF and ePub downloads, according to the available data) and Abstracts Views on Vision4Press platform.
Data correspond to usage on the plateform after 2015. The current usage metrics is available 48-96 hours after online publication and is updated daily on week days.
Initial download of the metrics may take a while.