Fig. 13.
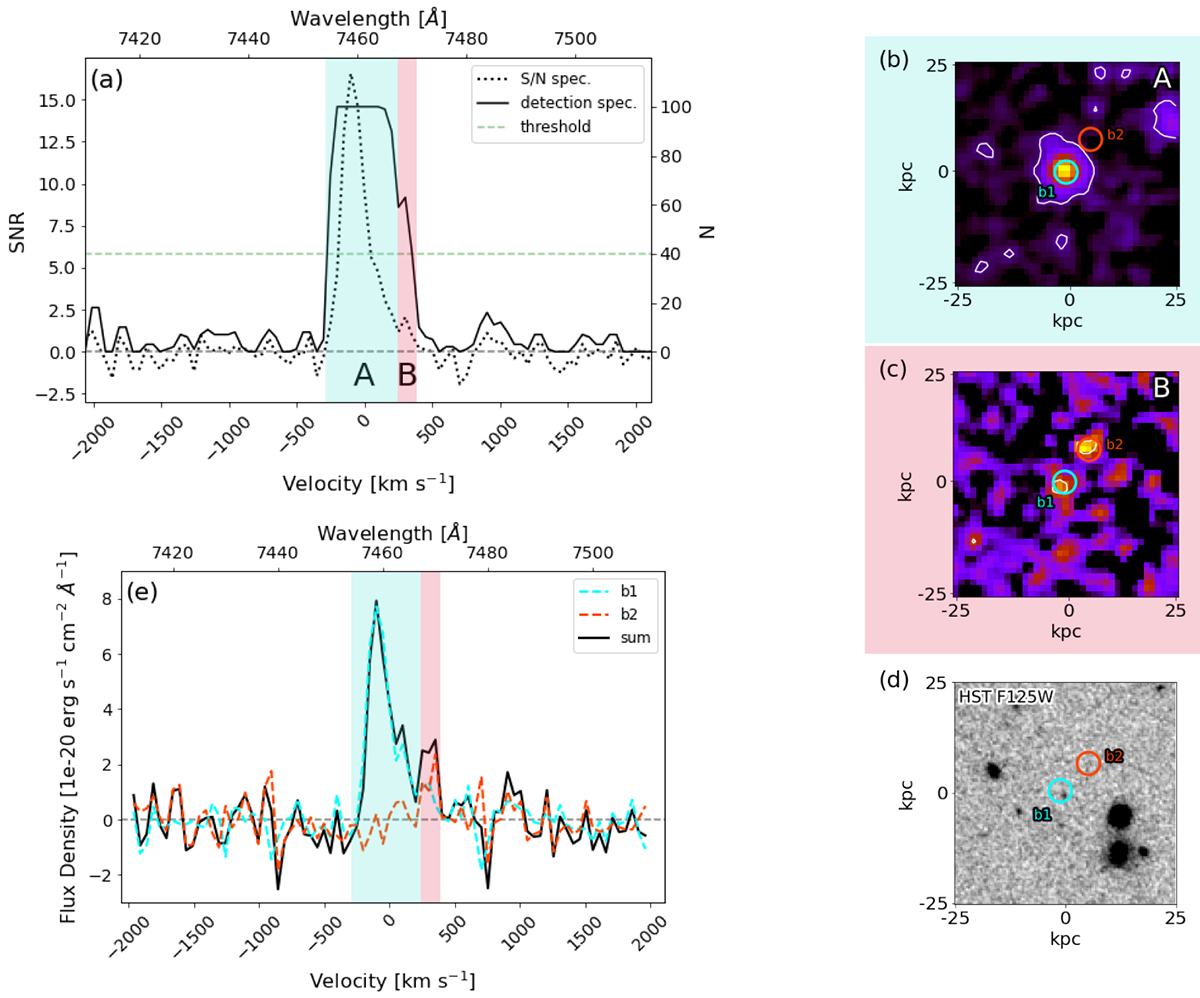
Download original image
ID 399, double-peak, BRONZE category. Example of a LAE surrounded by a satellite discovered thanks to our method. (a)–(c): Same as Fig. 3. The cyan circle b1 and the orange circle b2 represent the apertures used to extract two spectra at the indicated locations. The size of the circles represent a 0.5″ diameter aperture. (d): 50 × 50 kpc2 HST F125W image with the two locations of the extraction (cyan and orange circles). (e): Spectra extracted from the two circles. The orange dash-dotted line corresponds to the spectrum extracted at the position of b2. The spectrum extracted from b1 is shown as a cyan dashed line. The black line is the summed spectrum of the blue and orange spectra. The spectrum extracted at the position b2, that is the position of the satellite, contributes mainly to the peak B.
Current usage metrics show cumulative count of Article Views (full-text article views including HTML views, PDF and ePub downloads, according to the available data) and Abstracts Views on Vision4Press platform.
Data correspond to usage on the plateform after 2015. The current usage metrics is available 48-96 hours after online publication and is updated daily on week days.
Initial download of the metrics may take a while.