Fig. 11.
Download original image
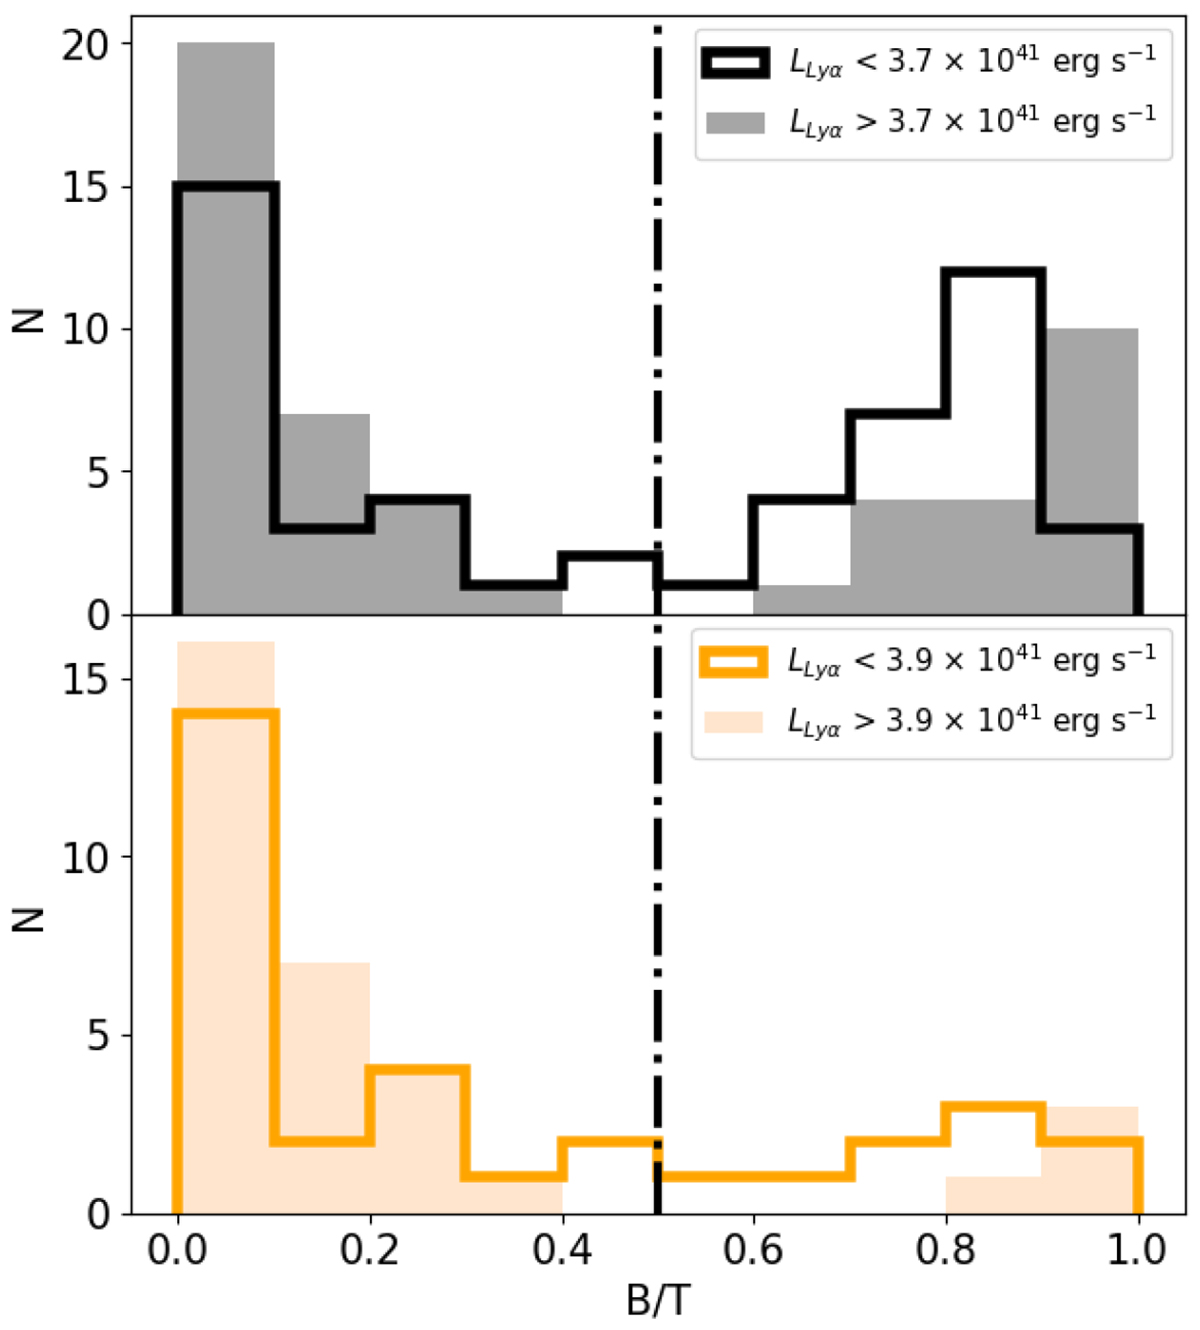
B/T flux ratio distributions shown for bright and faint galaxies. Top panel: B/T flux ratio distributions of the inclusive unbiased double-peak sample (UDPI) divided into two Lyα luminosity bins with the same number of objects (53 and 52). The faint subsample (LLyα < 3.7 × 1041 erg s−1) is in black and the bright one (LLyα > 3.7 × 1041 erg s−1) is in grey. Bottom panel: B/T flux ratio distributions of the restrictive unbiased double-peak sample (UDPR) divided into two Lyα luminosity bins with the same number of objects (33 and 33). The faint subsample (LLyα < 3.9 × 1041 erg s−1) is in stepped orange and the bright one (LLyα > 3.9 × 1041 erg s−1) is in orange. B/T = 0.5 is represented by a black dash-dotted line in both panels.
Current usage metrics show cumulative count of Article Views (full-text article views including HTML views, PDF and ePub downloads, according to the available data) and Abstracts Views on Vision4Press platform.
Data correspond to usage on the plateform after 2015. The current usage metrics is available 48-96 hours after online publication and is updated daily on week days.
Initial download of the metrics may take a while.