Fig. 1.
Download original image
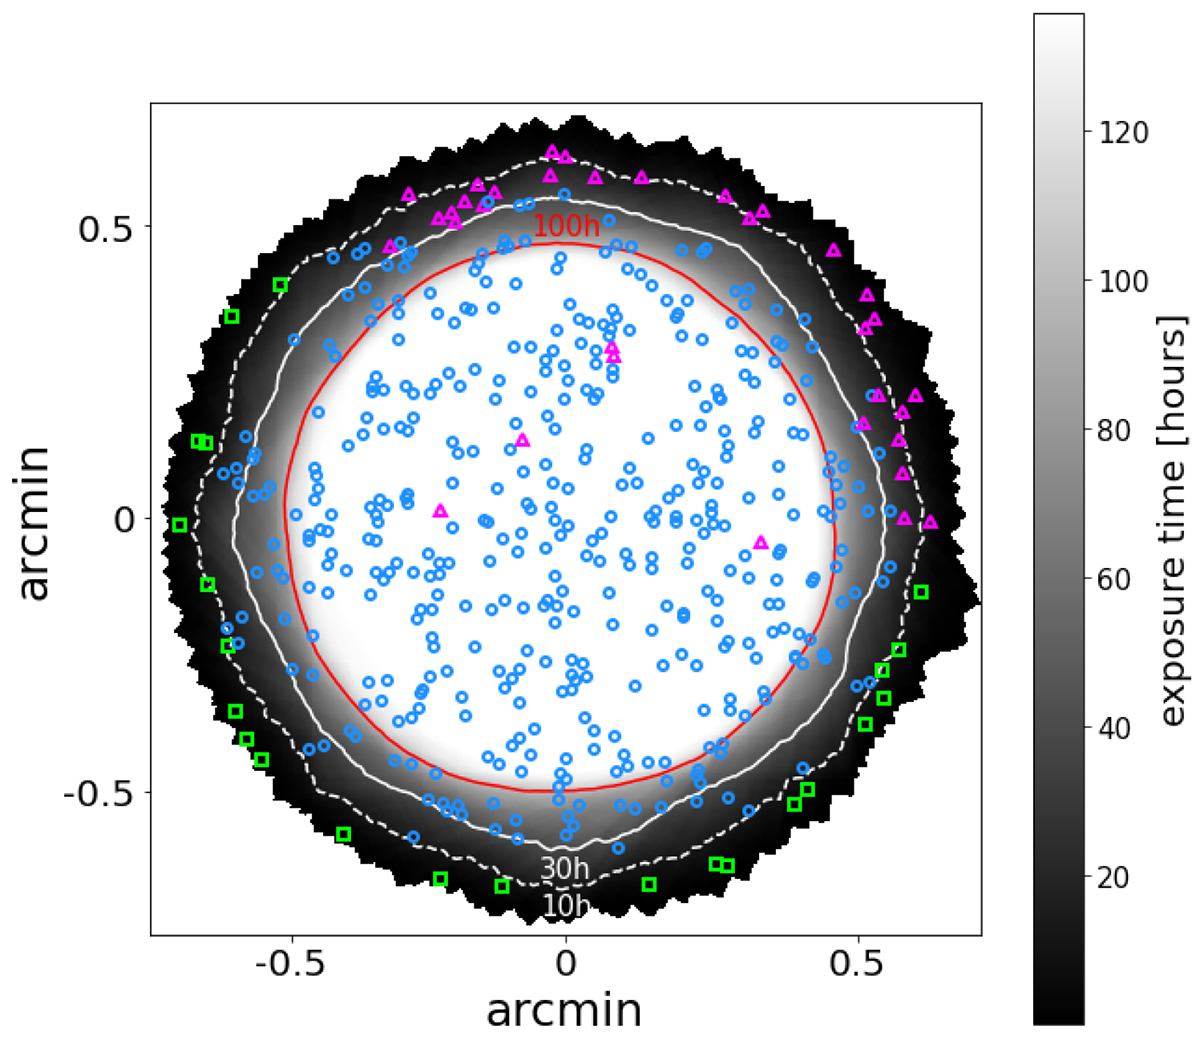
Exposure time map of the MXDF. The blue circles are the MXDF-selected objects, the pink triangles indicate the UDF-10-selected targets and the green squares the MOSAIC-selected objects (see Sect. 2.2). The field is coloured by exposure time in hours, from 0 h to 140 h. The red contour represents the 100 h limit of the field. The solid and dashed white contours show the 30 h and 10 h exposure time of the MXDF, respectively. The UDF-10-selected objects present in the deepest part of the field have their Lyα line in the AO gap.
Current usage metrics show cumulative count of Article Views (full-text article views including HTML views, PDF and ePub downloads, according to the available data) and Abstracts Views on Vision4Press platform.
Data correspond to usage on the plateform after 2015. The current usage metrics is available 48-96 hours after online publication and is updated daily on week days.
Initial download of the metrics may take a while.