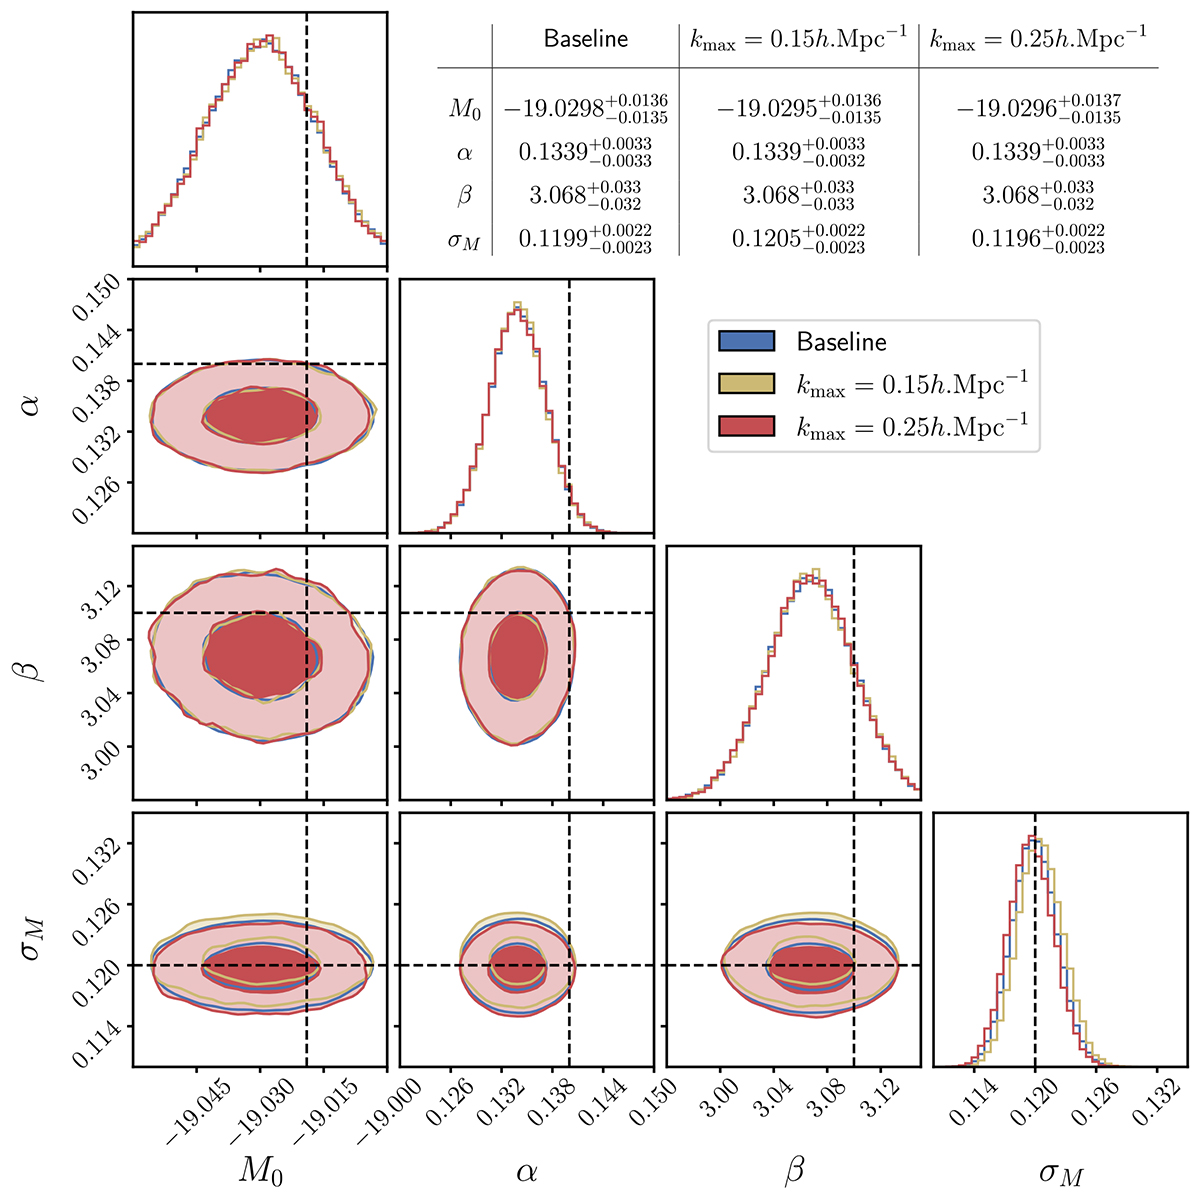
Fig. B.2.
Download original image
MCMC results of the Hubble diagram fit using three different values of kmax to compute the power spectrum Pθθ for the complete velocity covariance. The fit is performed on the same realization shown in Fig. 2. The dashed black lines show the simulation input value for each parameter. The baseline refers to kmax = 0.2 h−1Mpc as described in Sect. 3. The table shows the median posterior probability, the fitted value, for each parameter and the relative error.
Current usage metrics show cumulative count of Article Views (full-text article views including HTML views, PDF and ePub downloads, according to the available data) and Abstracts Views on Vision4Press platform.
Data correspond to usage on the plateform after 2015. The current usage metrics is available 48-96 hours after online publication and is updated daily on week days.
Initial download of the metrics may take a while.