Open Access
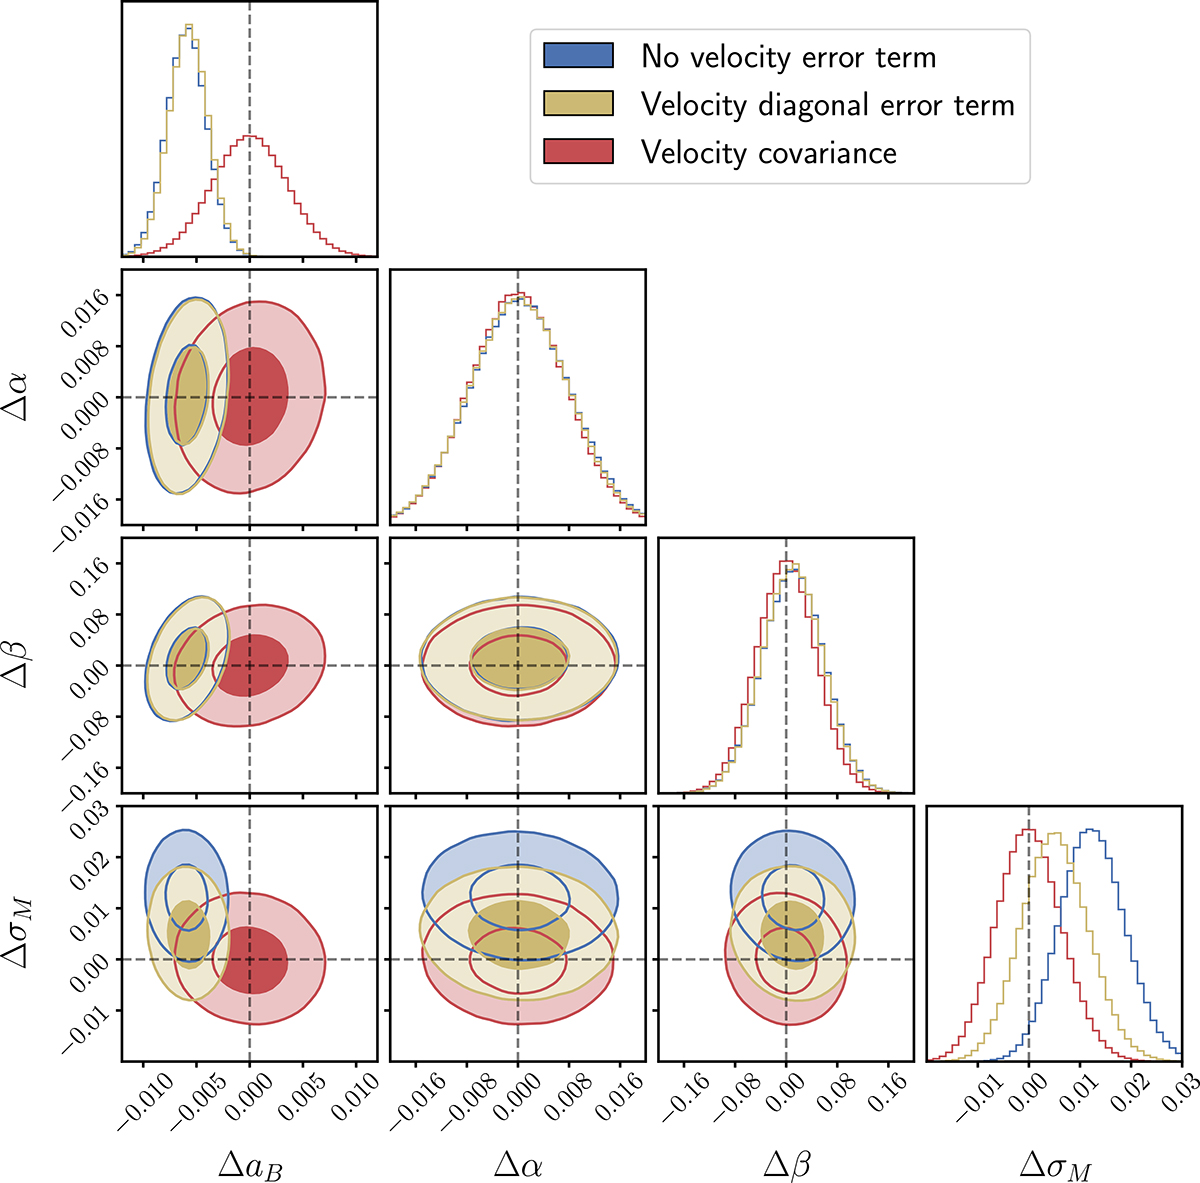
Fig. 5.
Download original image
MCMC results of the Hubble diagram fit for the ZTF SN Ia DR2 data using the three different methods of computing the PV covariance matrix described in Sect. 3. The symbols and colors are the same as in Fig. 2. The contours are shifted relative to the results obtained using a full covariance matrix for PVs.
Current usage metrics show cumulative count of Article Views (full-text article views including HTML views, PDF and ePub downloads, according to the available data) and Abstracts Views on Vision4Press platform.
Data correspond to usage on the plateform after 2015. The current usage metrics is available 48-96 hours after online publication and is updated daily on week days.
Initial download of the metrics may take a while.