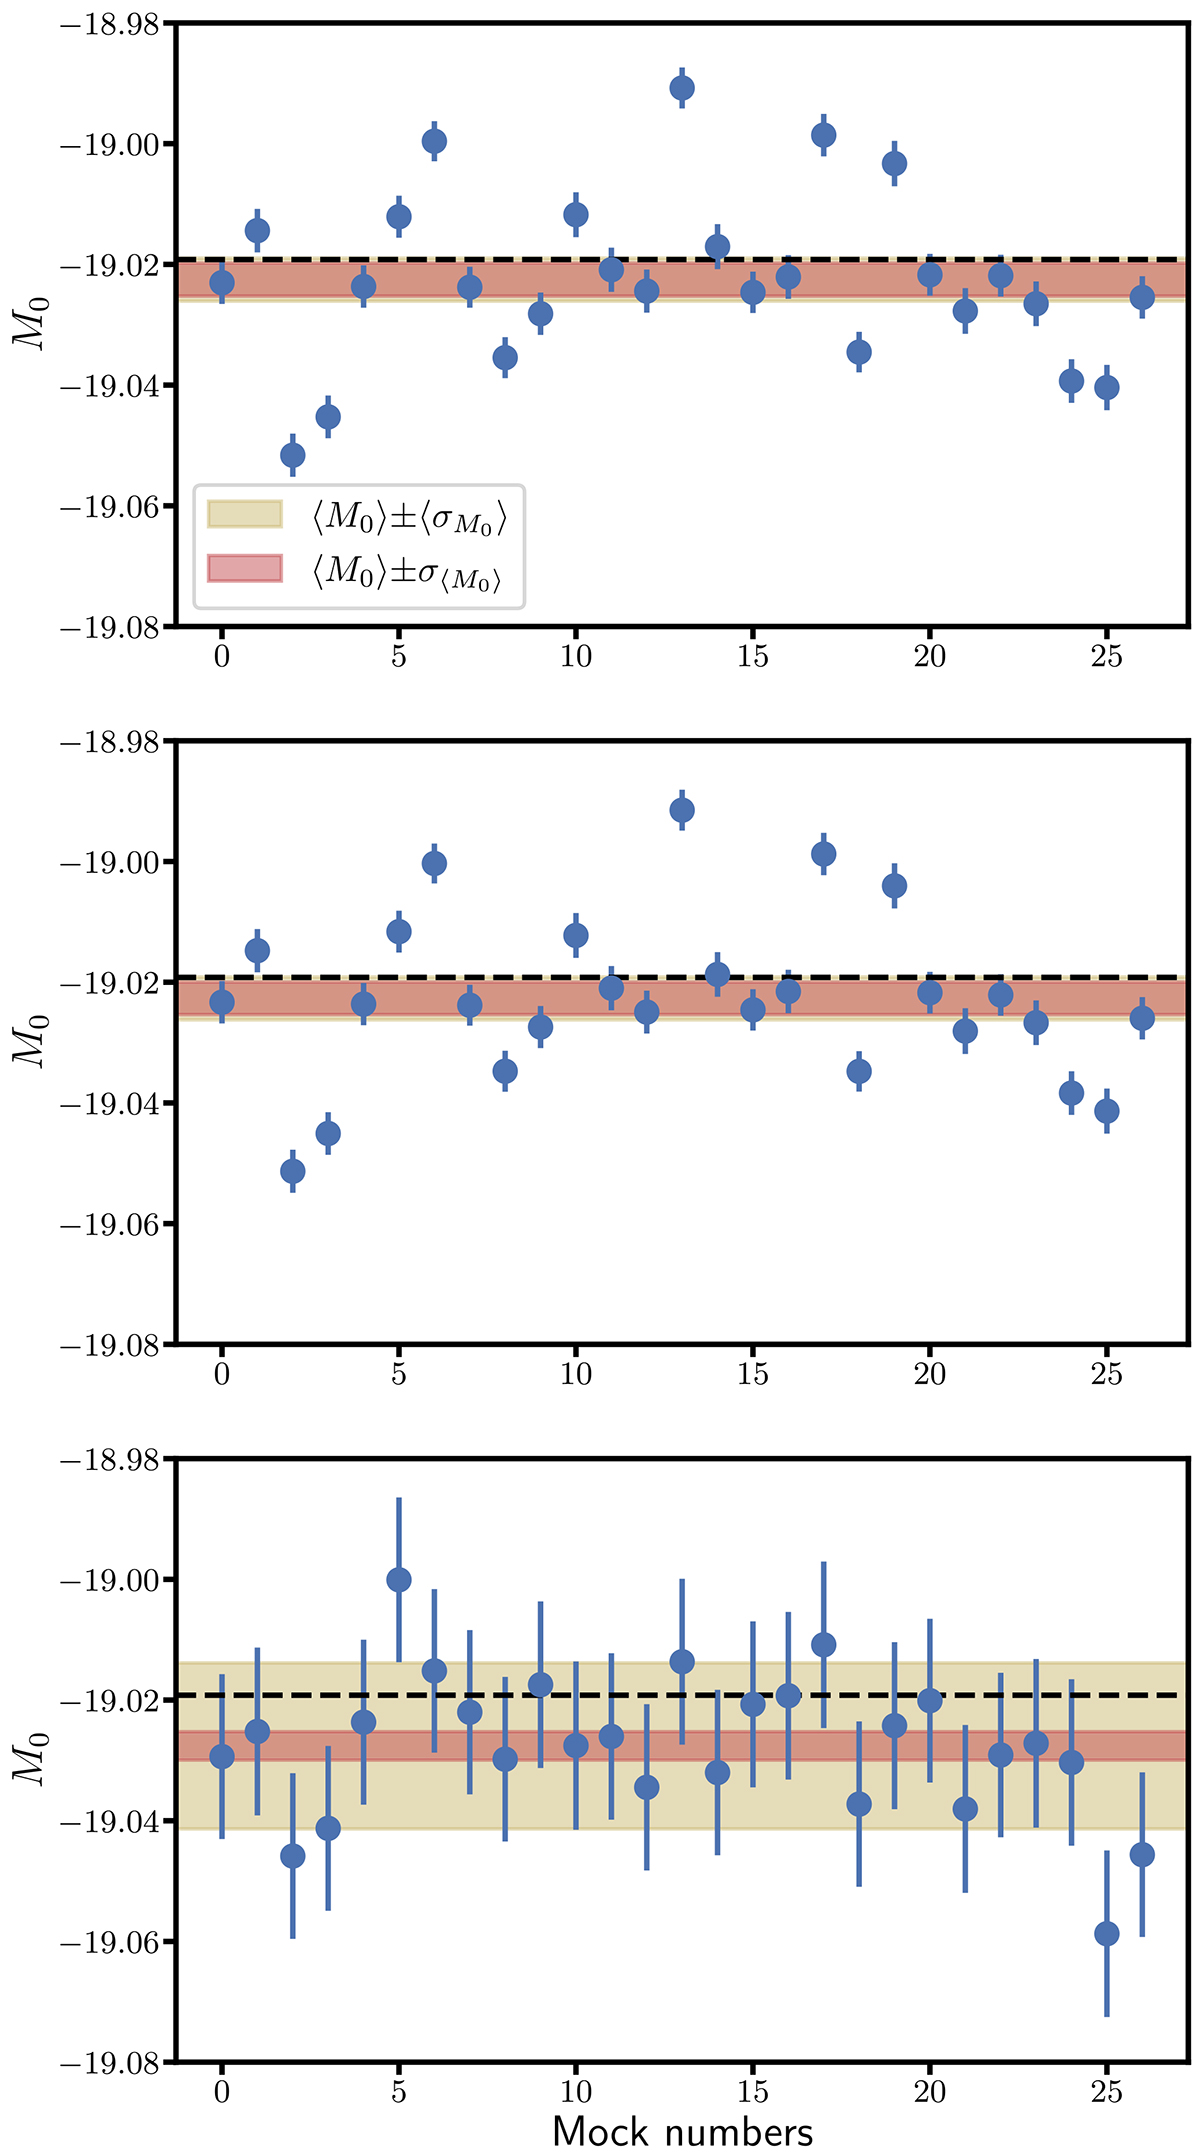
Fig. 3.
Download original image
M0 values obtained from the fit of the 27 realizations (realization number 8 is the one used in Fig. 2). The blue dots are the results of the fits with error bars from iminuit, while the dashed black line shows the M0 input value of the simulations. The shaded red area is centered on the mean M0 value ⟨M0⟩ obtained from the 27 realizations and it shows the uncertainty on ⟨M0⟩. The shaded yellow area is also centered on ⟨M0⟩, but shows the average uncertainty along the 27 realization results, ⟨σM02⟩1/2. Top panel: Fit without velocity error term. Middle panel: Fit with a velocity diagonal error term. Bottom panel: Fit with a full velocity covariance.
Current usage metrics show cumulative count of Article Views (full-text article views including HTML views, PDF and ePub downloads, according to the available data) and Abstracts Views on Vision4Press platform.
Data correspond to usage on the plateform after 2015. The current usage metrics is available 48-96 hours after online publication and is updated daily on week days.
Initial download of the metrics may take a while.