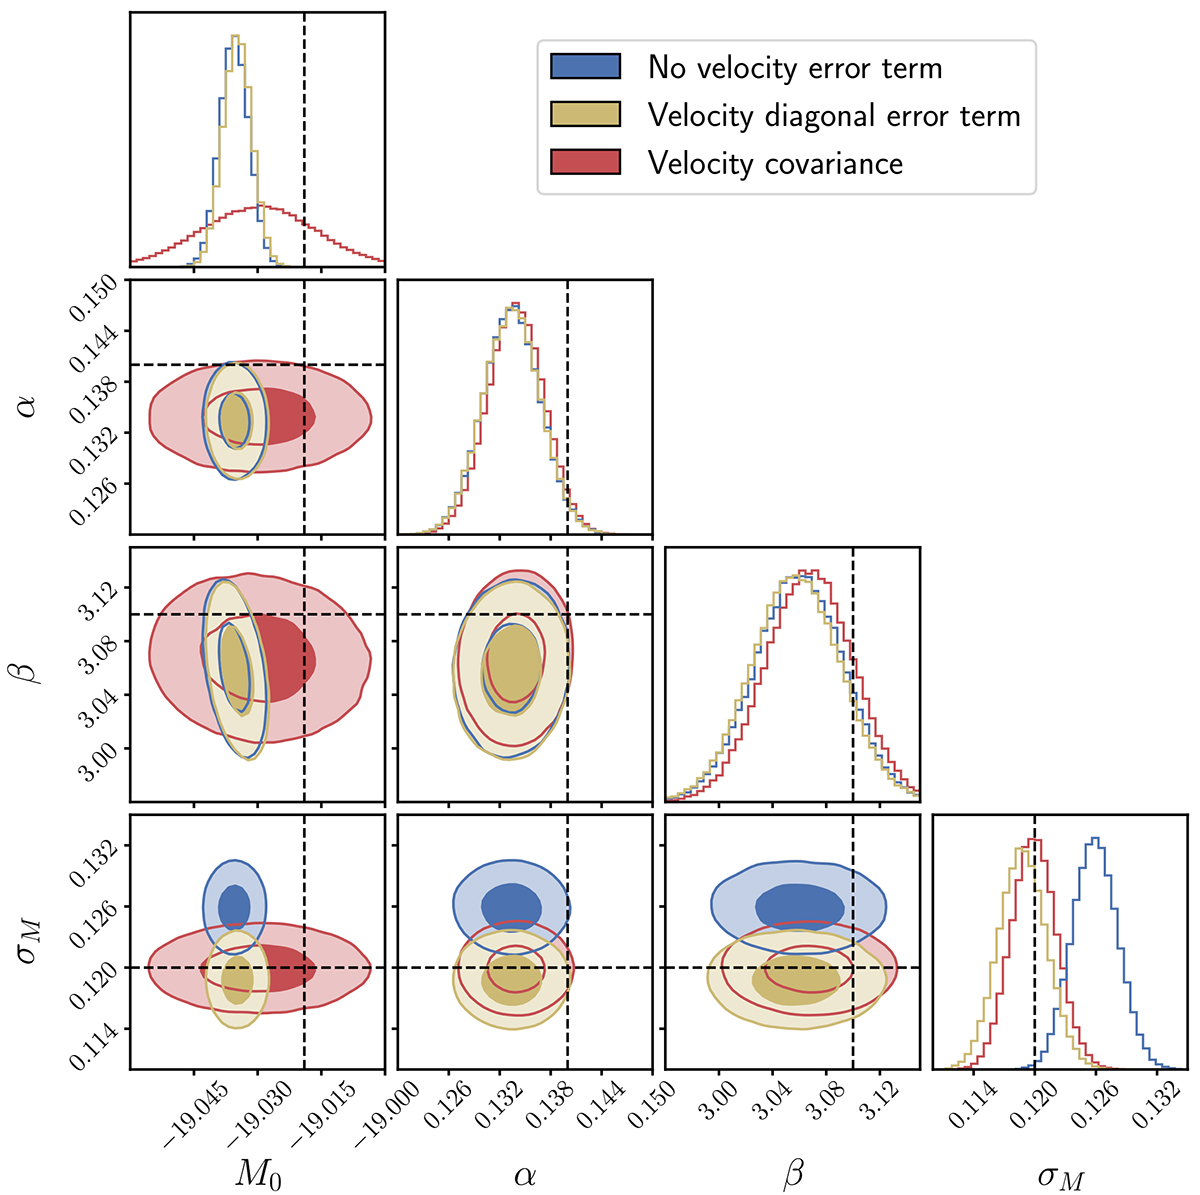
Fig. 2.
Download original image
MCMC results of the Hubble diagram fit using the three different methods to compute the PV covariance matrix described in Sect. 3. The fit was performed on one random realization. The dashed black lines show the simulation input value for each parameter. The blue contours show the posterior probability for each parameter when the PV covariance matrix is equal to zero, and PVs are not taken into account. The yellow contours show the results when the covariance matrix is just diagonal, assuming that σv = 250 km s−1. Finally, the red contours were obtained when we took into account the PV correlation and the covariance matrix was computed using the linear power spectrum.
Current usage metrics show cumulative count of Article Views (full-text article views including HTML views, PDF and ePub downloads, according to the available data) and Abstracts Views on Vision4Press platform.
Data correspond to usage on the plateform after 2015. The current usage metrics is available 48-96 hours after online publication and is updated daily on week days.
Initial download of the metrics may take a while.