Fig. 1.
Download original image
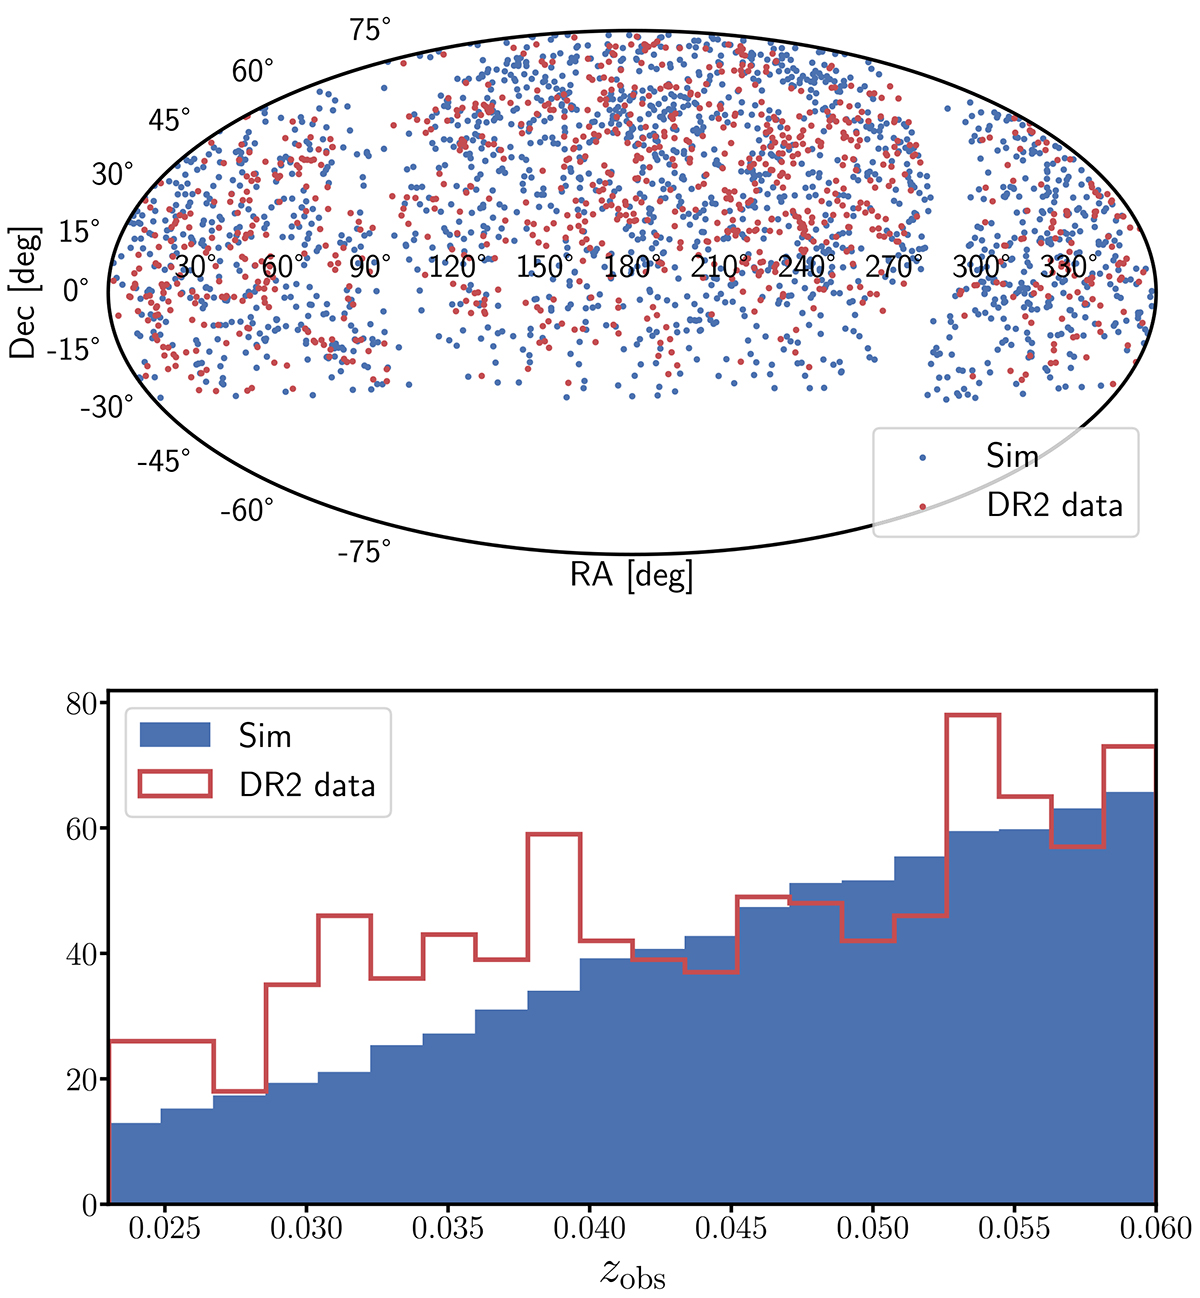
Comparison of the angular and redshift distributions of the SNe Ia from the simulation and from the ZTF SN Ia DR2 data. Top panel: Angular positions of simulated SNe Ia from one mock (in blue) and from the DR2 data (in red). Bottom panel: Redshift distribution averaged over the 27 mocks and rescaled for the difference in the duration of the survey (in blue) compared to the DR2 redshift distribution (in red).
Current usage metrics show cumulative count of Article Views (full-text article views including HTML views, PDF and ePub downloads, according to the available data) and Abstracts Views on Vision4Press platform.
Data correspond to usage on the plateform after 2015. The current usage metrics is available 48-96 hours after online publication and is updated daily on week days.
Initial download of the metrics may take a while.